
労働力レポートソフトウェアで重要なものを測定する
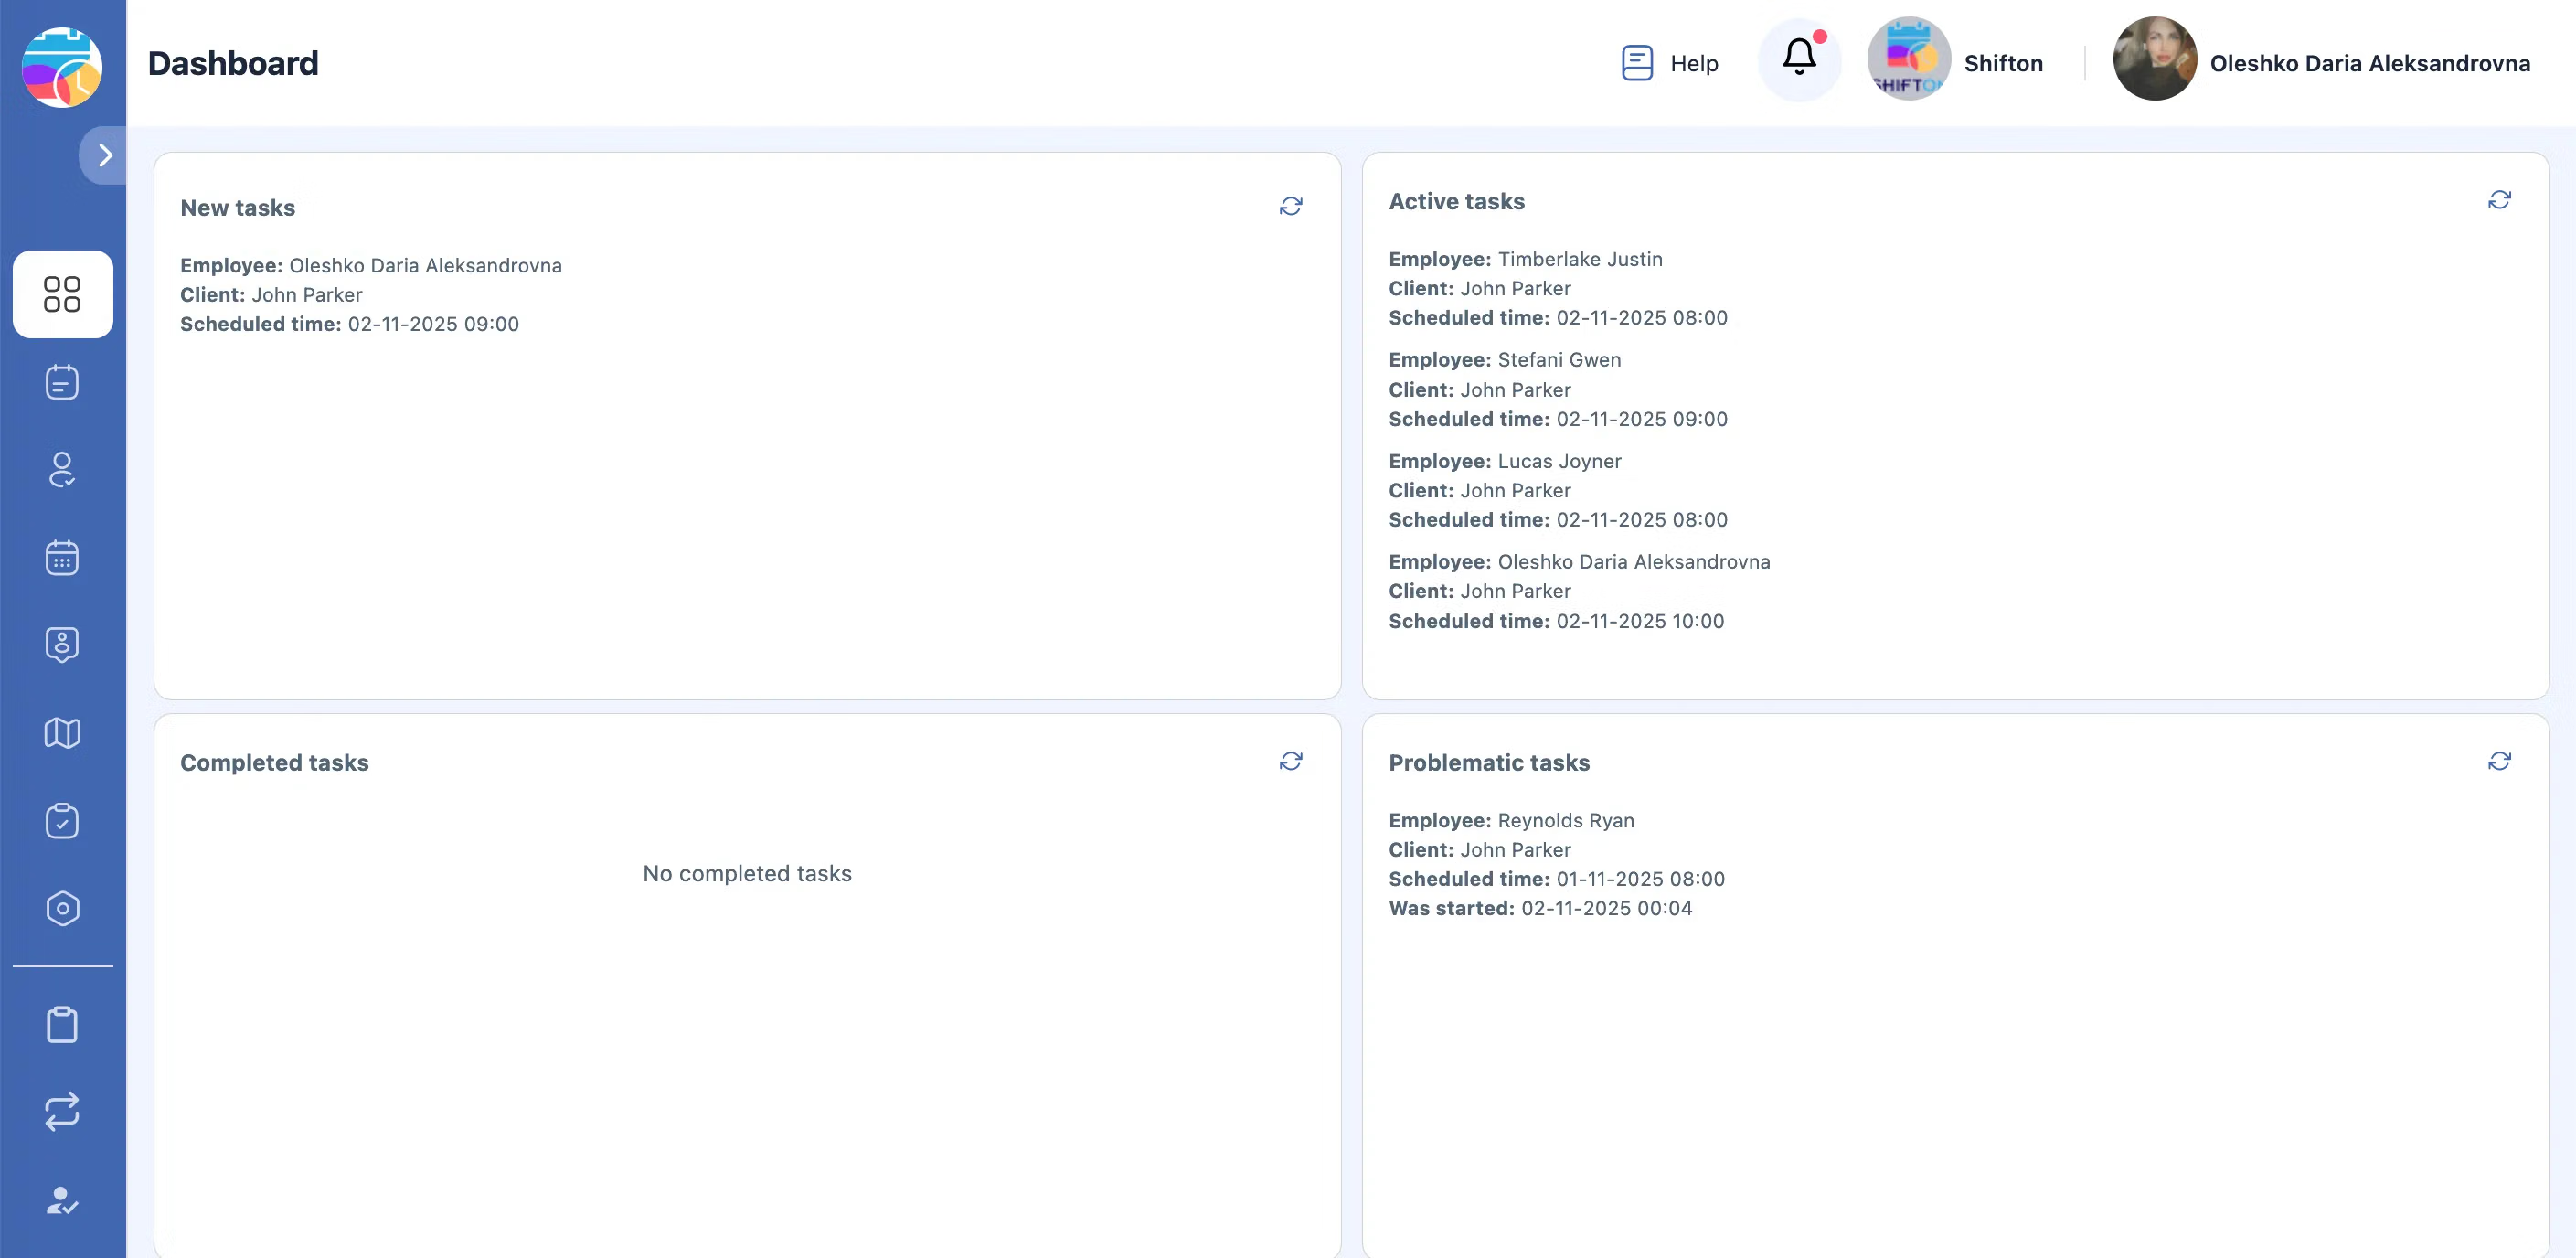
Field service operations generate massive amounts of data — task completions, job durations, technician assignments — but without a centralized dashboard, this data stays scattered and underused.
One dashboard replaces scattered spreadsheets — giving managers the visibility they need to make better decisions.
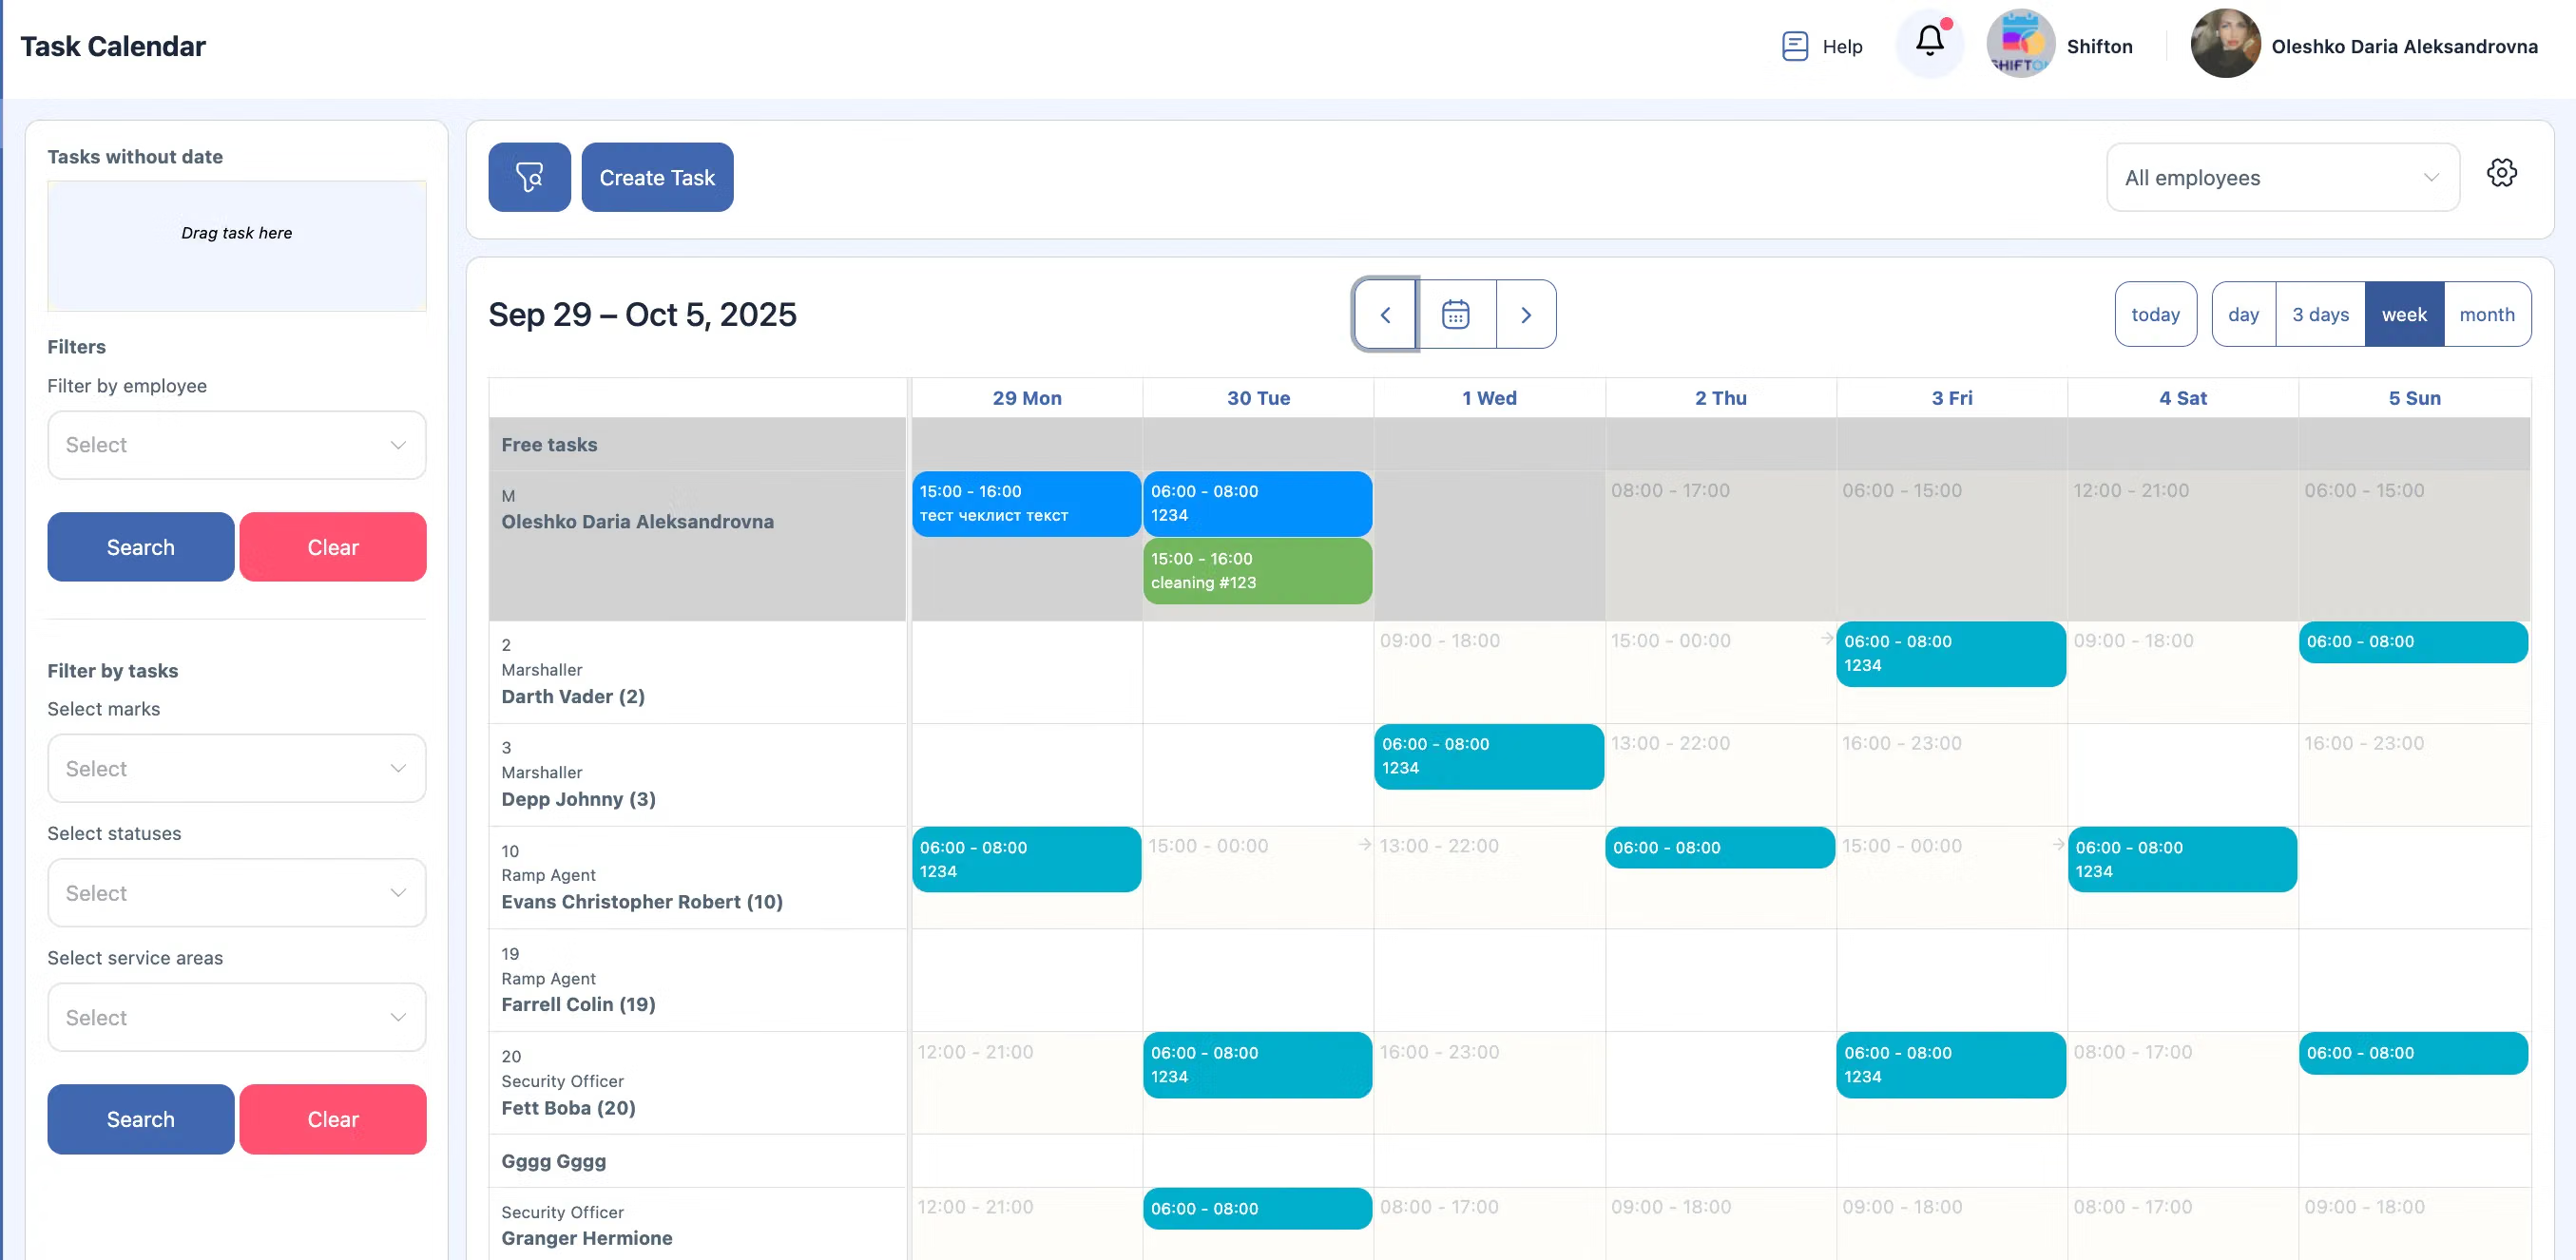
自動的にフィルタリングされ、常に正確な労働力レポート
レポーティング・KPIのための専門フィールドサービスツールキット。コーディネーター、ディスパッチャー、技術者が同じリアルタイム画面を共有。
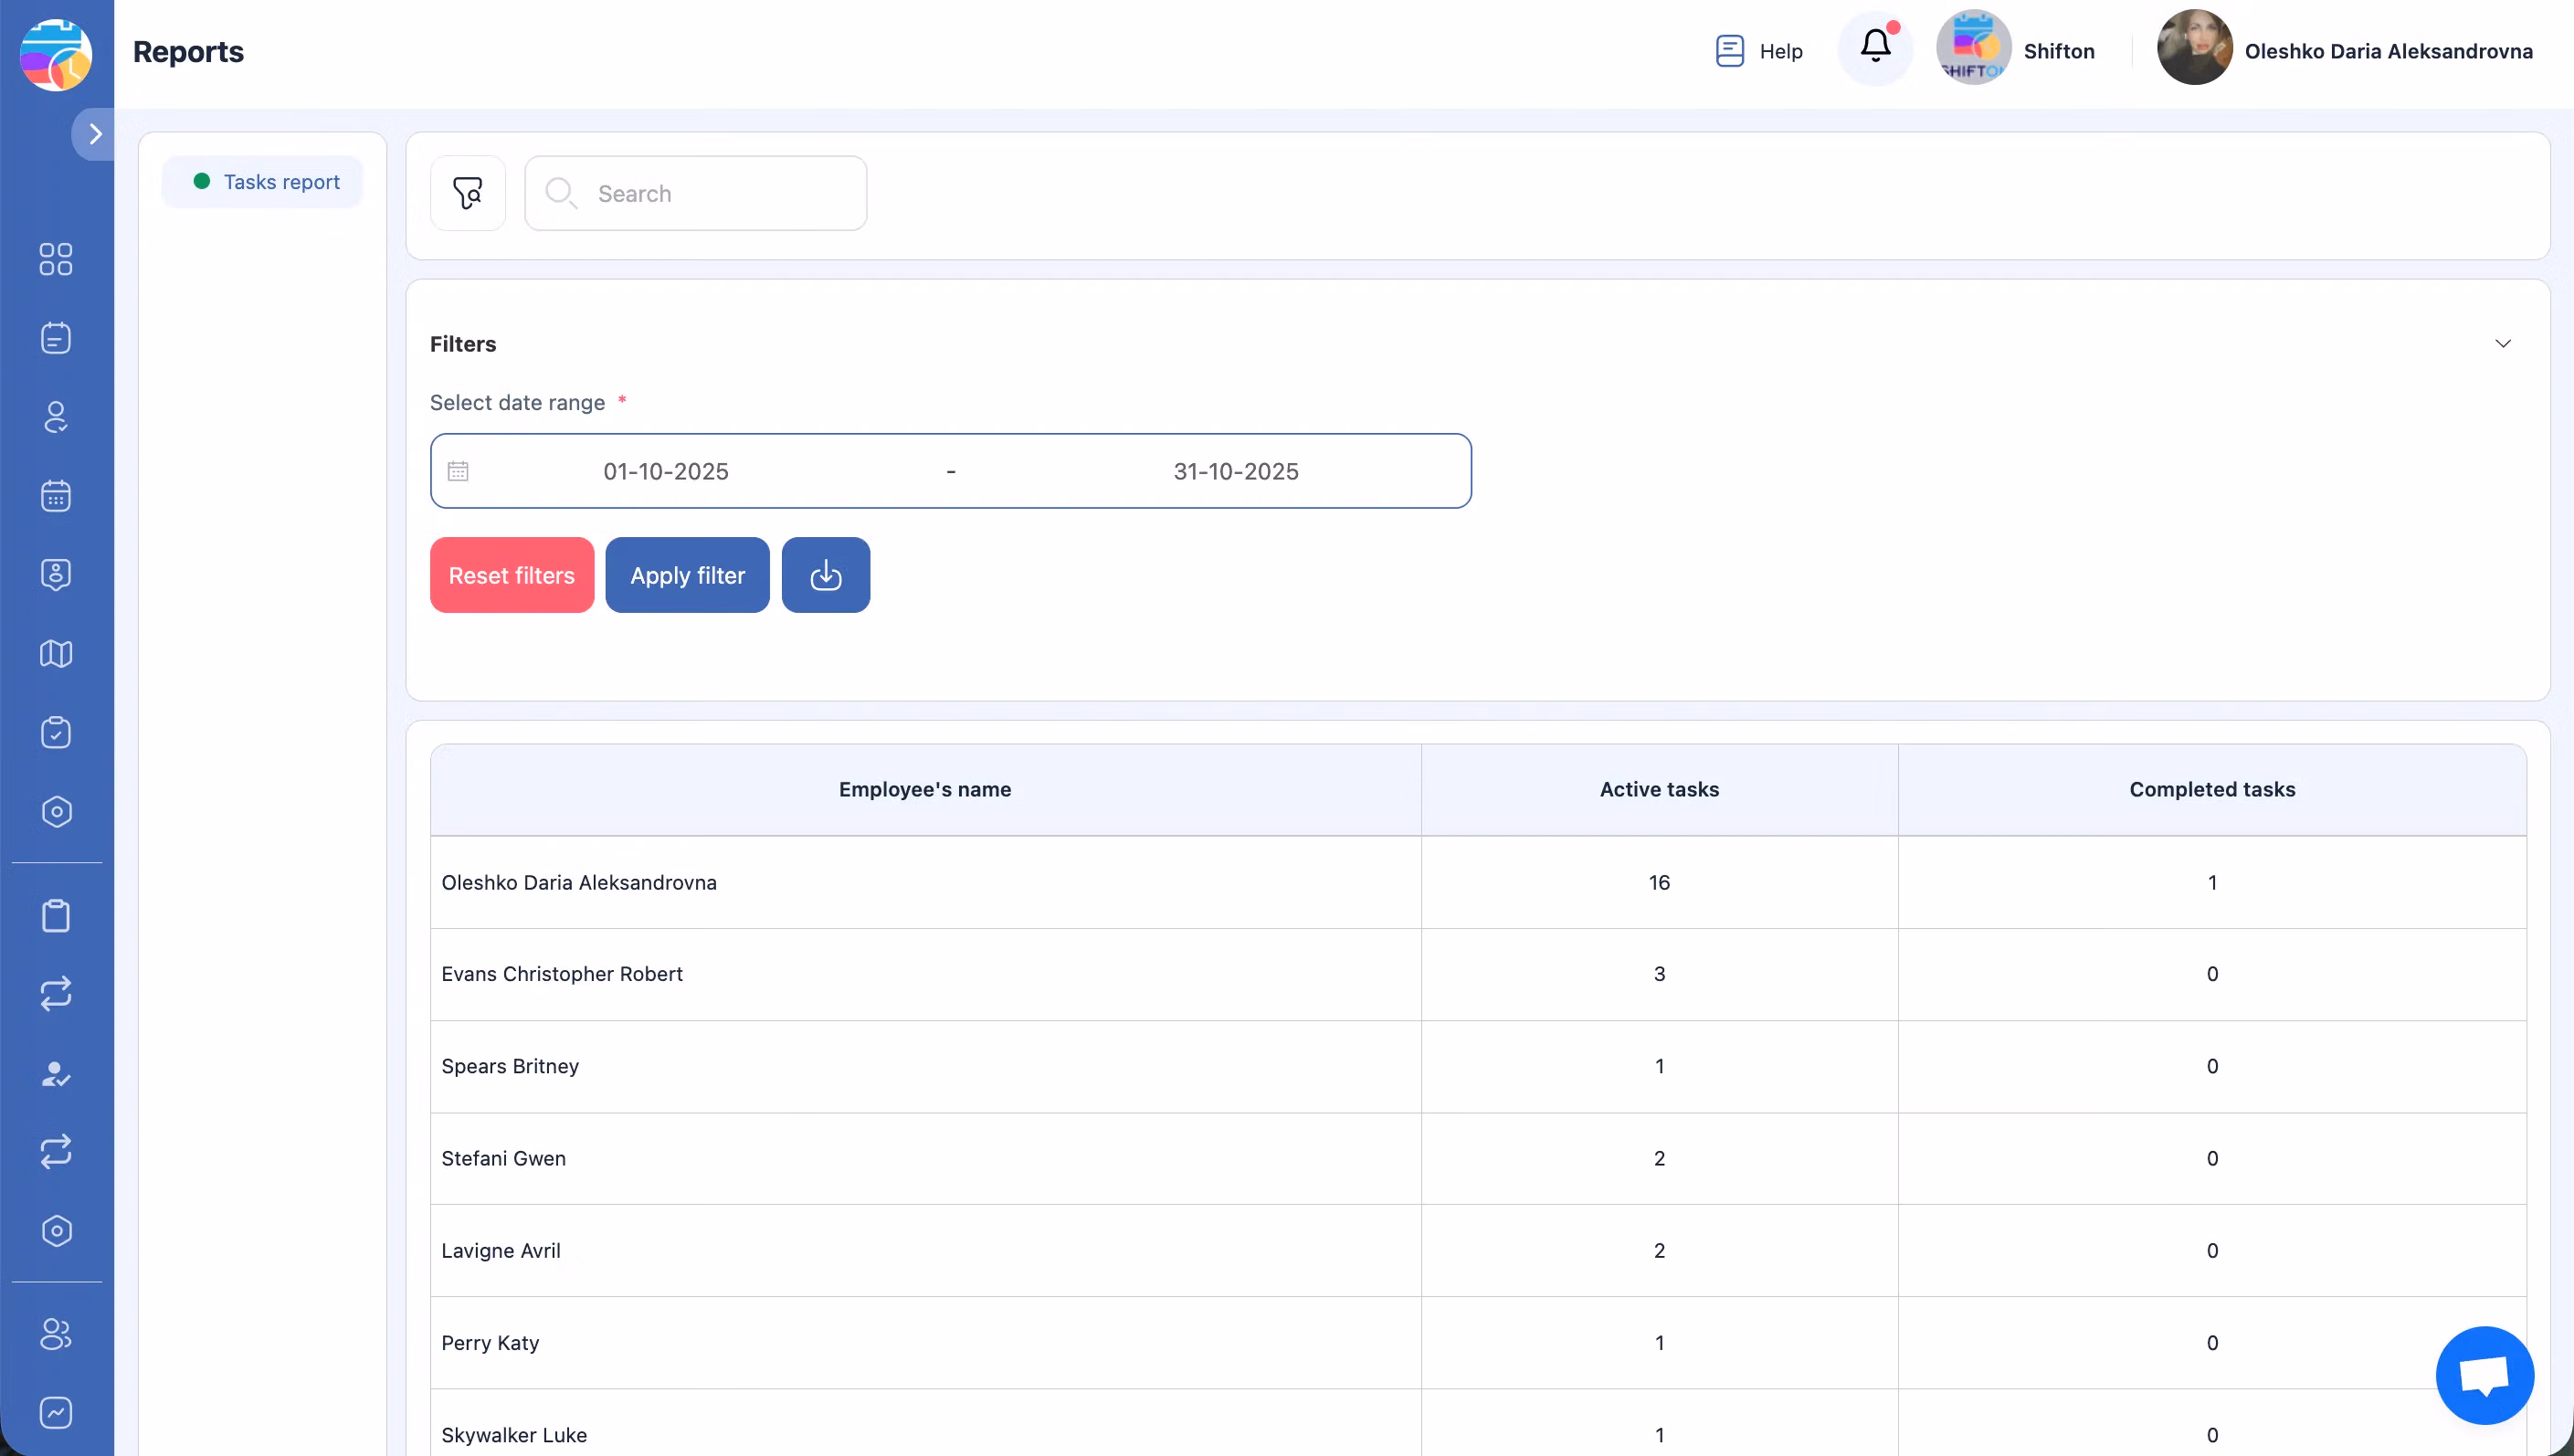
Accurate reporting without manual effort — managers spend time on decisions, not data entry.
データから決断へ — 労働力レポートソフトウェアで最適化
Identifying operational weak points — slow routes, recurring delays, uneven workload — requires data that most teams don't have readily available.
Real data replaces guesswork — every operational decision is backed by evidence from the field.
透明性による成長:データ駆動型の労働力分析
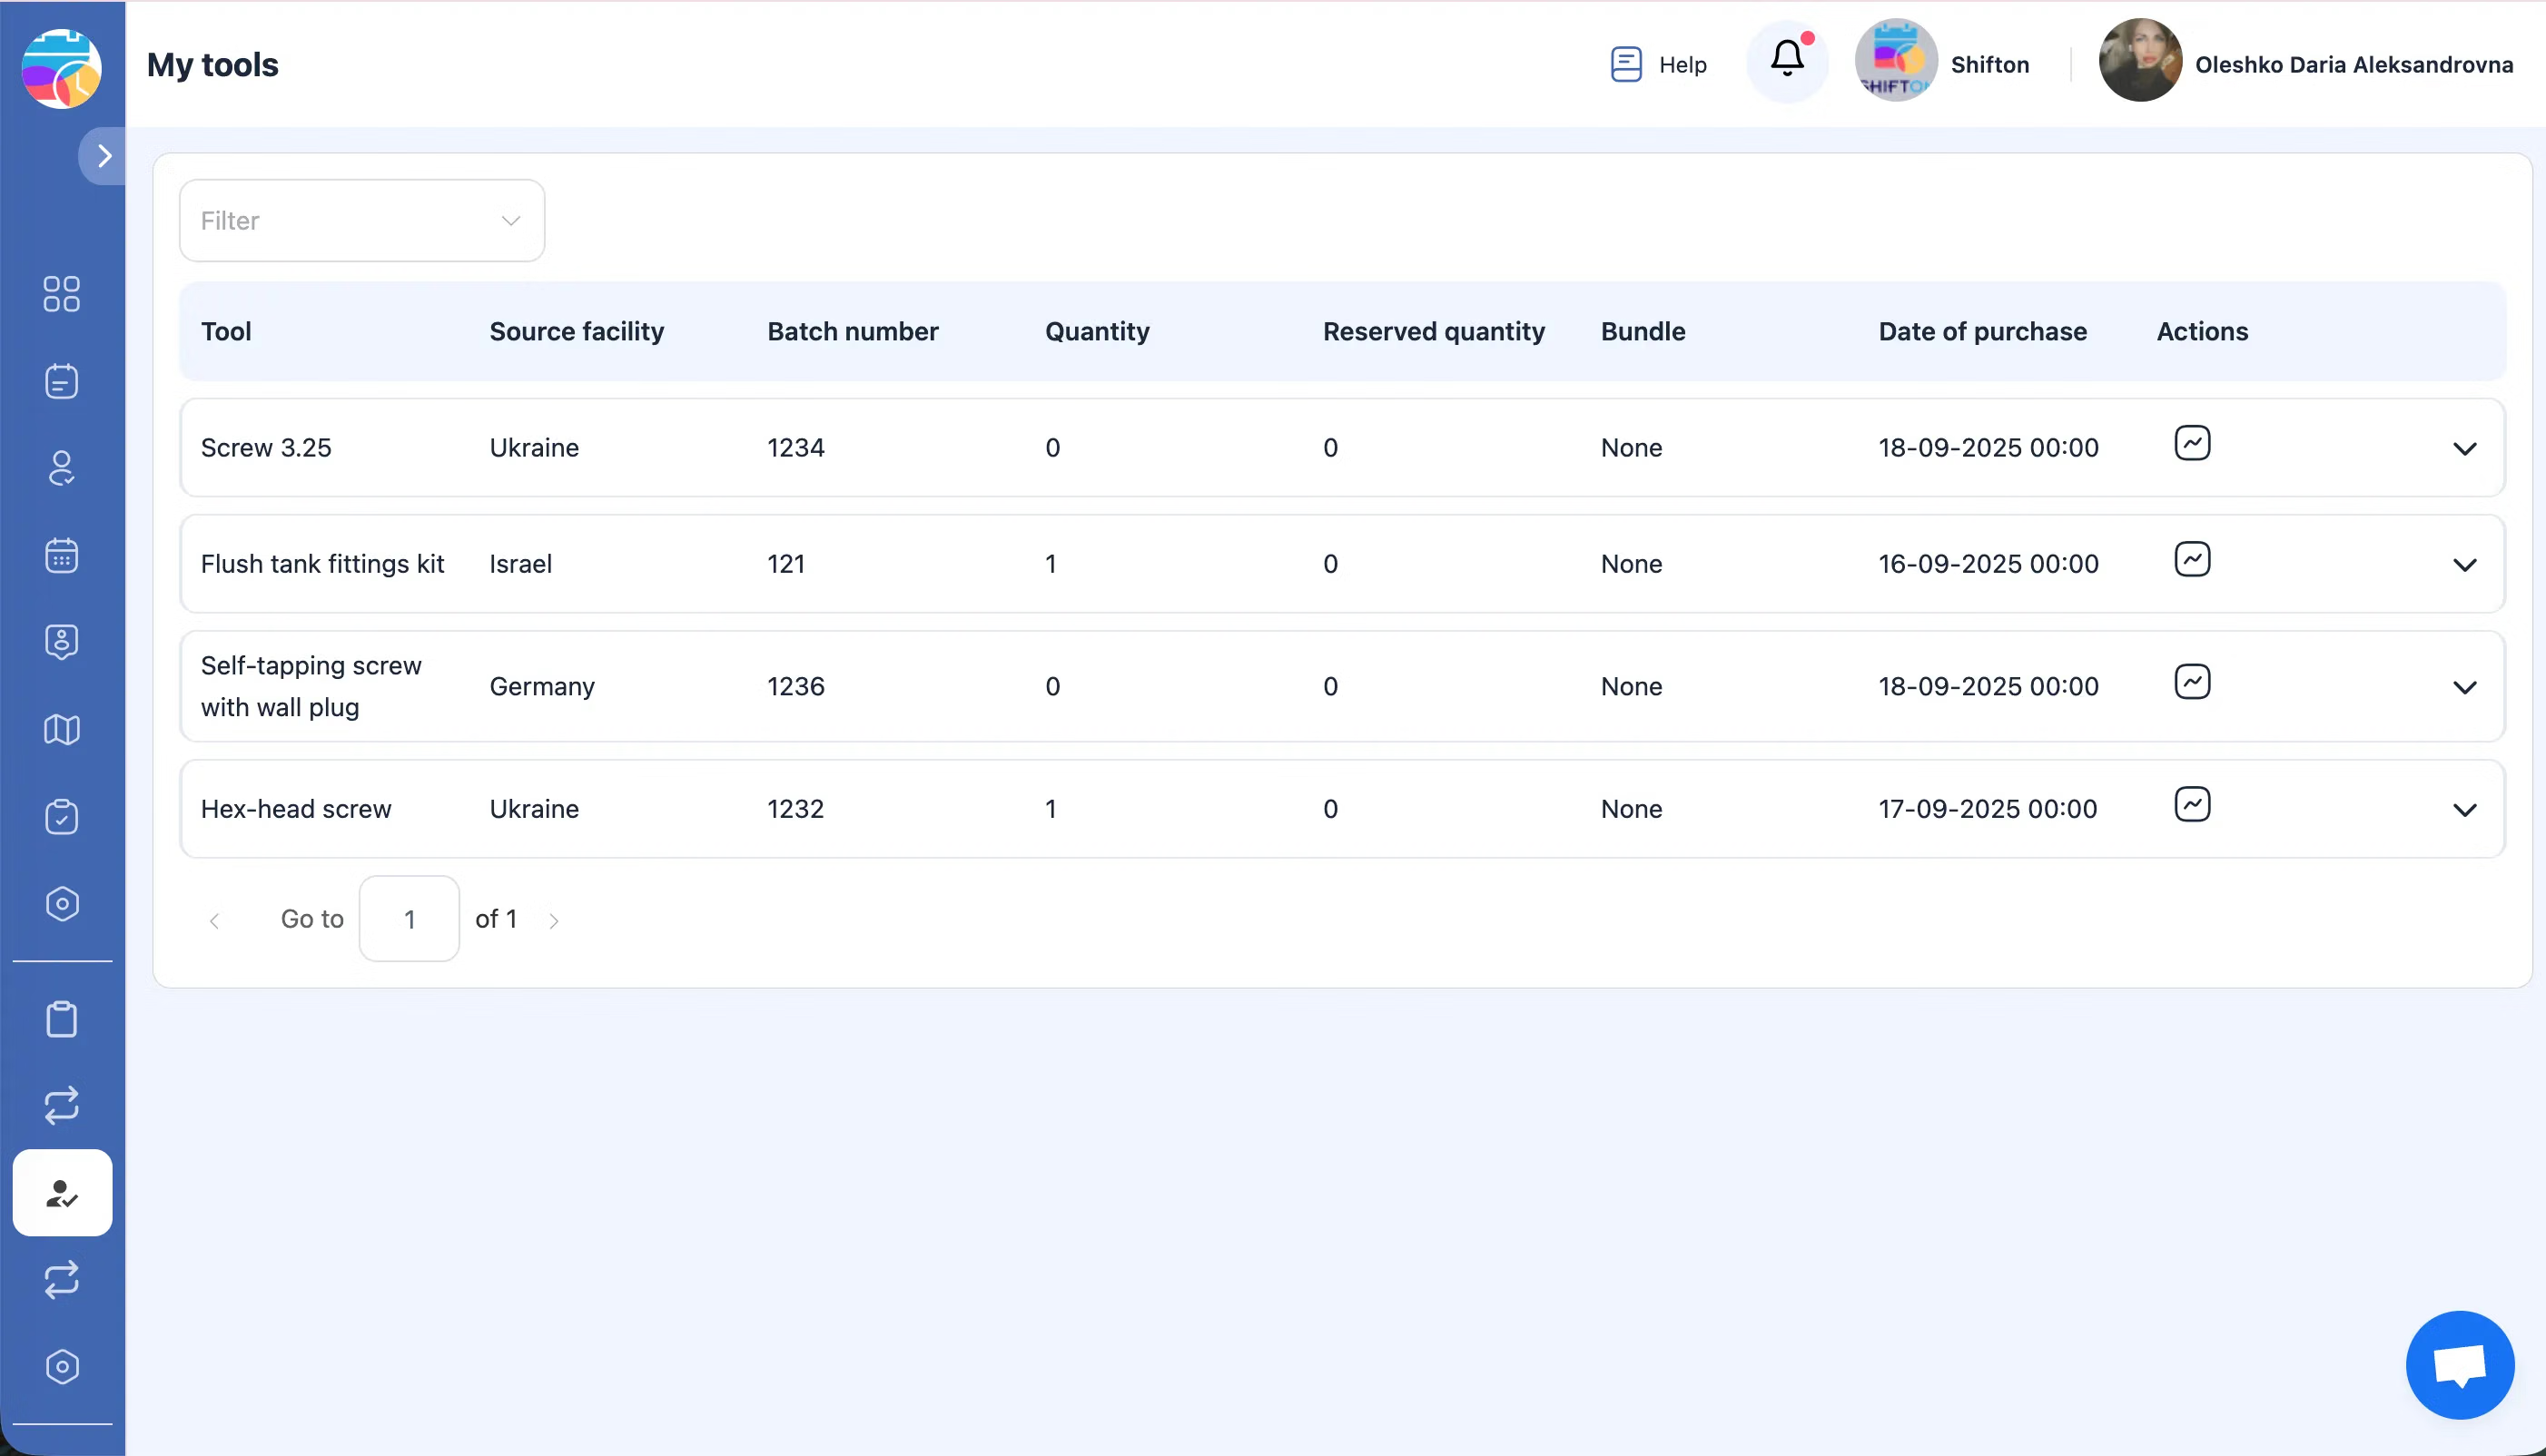
Scaling a field service operation without historical data means guessing — when to hire, which zones need coverage, and where to invest resources.
Shifton Field Serviceはレポーティング・KPIチームに統一された運用ビューを提供 — リアルタイム制御と各プロジェクトでの作業証明。
無料プランで始めましょう
期間制限なし。コア機能にフルアクセスし、準備ができたらアップグレード。
よくある質問
Shiftonはどのようなレポートを提供しますか?
完了タスクとアクティブタスクの数、クライアント評価、タスク完了にかかった時間、総労働時間に関するレポート。
日付、チーム、またはゾーンでレポートをフィルタリングできますか?
はい。すべてのレポートは日付範囲、技術者、クルー、サービスゾーン、ジョブタイプ、顧客でフィルタリングできます。CSVまたはPDFにエクスポートします。
レポートは自動生成されますか?
はい。ジョブが完了するとダッシュボードがリアルタイムで更新されます。
ジョブごとの収益と収益性を追跡できますか?
はい。Shiftonはジョブ別、技術者別、ゾーン別の収益を報告します——労働コスト、部品、移動を含みます。どのジョブと顧客が最も収益性が高いかを確認します。
レポートは基本プランに含まれていますか?
はい。レポートダッシュボードと分析は「タスク」ベースモジュールの一部で、従業員2名まで無料です。大規模チームの場合、従業員1名あたり月額$5.00です。