Workforce Reporting Software for Operational Teams
Turn time-clock logs and schedule data into reports that actually drive decisions. Pre-built templates, custom builders, and scheduled delivery, all powered by your live workforce data.

Pre-Built Workforce Reports for Immediate Insights
Most workforce data sits unused in time-clock logs and scheduling databases because nobody on the team knows how to extract it. The data is there, the value is real, and the analyst who could pull it costs more than the entire scheduling tool. Pre-built report templates close the gap by turning the most asked questions into one-click answers.
Attendance rates, overtime costs, schedule adherence: ready to read without a SQL query.
Custom Report Builder for Specific Business Needs
No two operational businesses measure performance the same way. A restaurant cares about labor cost per cover. A hospital tracks nurse-to-patient ratios. A warehouse measures picks per labor hour. Generic reports miss every industry-specific KPI that actually matters, and most platforms force a custom development project to add one.
The right reporting software lets a manager build the metric they need without involving engineering.
Automated Report Delivery and Scheduled Exports
The Monday-morning labor report should not require a Monday-morning login. The Friday CFO summary should not require a Friday afternoon panic. Reports that depend on someone remembering to run them get run inconsistently, which means the data behind weekly decisions is also inconsistent. Automated delivery is what makes data-driven operations reliable instead of aspirational.
Scheduled exports turn the report from a task into infrastructure.
Trend Analysis and Predictive Workforce Insights
A point-in-time report tells you what happened last week. A trend chart tells you whether last week was the start of something or noise. The difference matters when you are deciding whether to hire, whether to renegotiate a vendor contract, or whether the new shift pattern is actually working. Trend analysis is the layer that turns reporting into management.
Historical context, seasonal forecasts, and turnover correlation are not luxury features. They are how managers see what is coming.
Start with the Free Plan
No time limits. Get full access to core features and upgrade when you're ready.
Read more about workforce reporting
Workforce reporting is one of those categories that almost every operational business needs and almost no operational business does well. The data exists in the scheduling tool. The questions that depend on the data are obvious. The gap is in the middle: the layer that turns raw data into reports a manager can read in five minutes and act on in ten.
Most teams either ignore the gap or hire a part-time analyst to fill it manually. Neither approach scales. Ignoring the gap means decisions get made on impressions, which produces the same kind of mediocre operations everyone else has. Hiring an analyst means you pay for someone to spend half their day on tasks that should already be automated. The teams that compete on operations close the gap with software, not with people.
What workforce reporting software actually does
Four jobs done well, not twenty jobs done loosely:
- Pre-built templates for the questions every operational manager asks: who is on time, where is the overtime going, how does this week compare to last week.
- A custom builder so the metric specific to your business (labor cost per cover, picks per labor hour, nurse-to-patient ratio) can be defined once and reused.
- Automated delivery so the report shows up in the right inbox at the right cadence without anyone running it manually.
- Trend analysis that turns point-in-time data into patterns managers can act on before the issue lands.
Everything else is decoration. A platform that nails these four turns scheduling data into a real management advantage. A platform that misses any of them is just a database with a nicer login screen.
The cost of not having real workforce reports
Most operational businesses underestimate how much money runs through their workforce data without anyone looking at it. The labor budget that drifts three percent over plan because nobody flagged the overtime accumulation in week two. The high-performing employee who left because their reliability was never visible to the manager. The seasonal staffing miss that cost two weekends of revenue because last year's pattern was buried in the archive.
Each of these mistakes is small in isolation. Stack them across a year and you have hundreds of thousands of dollars of value that the business produced and then leaked because the data was never converted into action. Real workforce reporting software keeps the value inside the business. The investment pays back in the first quarter, often in the first month, depending on the size of the operation.
What changes when reports actually work
The clearest way to see the value is to compare a manager-week before and after.
Before: the manager runs the labor report on Friday afternoon by exporting timesheet data into a spreadsheet, manually calculating overtime and absence rates, and emailing the result to the regional director. The export takes 90 minutes if nothing breaks. Something usually breaks. The data lands too late to act on, the next week starts with the same problems repeating, and the manager spends the weekend feeling behind.
After: the report runs automatically every Friday morning, lands in the regional director's inbox by 8 AM, and the manager sees the same numbers from their phone before lunch. The labor variance gets discussed Friday afternoon, the schedule for next week gets adjusted on Saturday, and Monday starts with the right plan. The same team produces the same revenue with two fewer hours of overtime per week, and the manager goes home on time.
None of this is dramatic. It is the quiet compounding effect of decisions being made on time, week after week, instead of on a delay.
The trend analysis layer most teams underuse
Point-in-time reports are useful but limited. The labor cost was up two percent last week. So what. Is it up because of a one-week event or the start of a trend that will keep building? Without historical context, the answer is a guess.
The trend analysis layer turns the same data into a chart that answers the question. Labor cost as a percentage of revenue, plotted month over month for the last two years, with the seasonal patterns visible at a glance. Overtime hours per employee, with the spikes that correlate to specific managers, locations, or time periods. Turnover correlated to scheduling consistency, so you can see whether the high-turnover team has a high-turnover problem or a high-instability problem.
None of these are exotic queries. They are the difference between knowing what happened and knowing what is happening. The teams that build the habit of looking at the trend before making the call run consistently better than the teams that look at the latest week and react.
What to look for when evaluating workforce reporting platforms
Build your hardest report inside the trial. The platform that demos beautifully on the standard attendance report is sometimes the platform that cannot handle a custom KPI like labor cost per cover. Pick the metric that actually drives decisions in your business and verify the platform can produce it without engineering work.
Test the export. Most platforms can produce a PDF that looks fine in a meeting. Fewer can produce the CSV format your finance team needs for reconciliation. Ask to see exports in CSV, Excel, and the specific format your accounting system expects. If the export is rigid, you will spend Friday afternoons reformatting reports by hand.
Verify how the platform handles role-based access on cost data. The team manager should not see the regional manager's compensation analysis. The HR director should see compensation, but the operations manager should not. If the access controls are weak or hard to configure, the platform creates compliance risk instead of reducing it.
When you actually need workforce reporting software
Below ten employees, manual reports plus a careful manager covers the basics. The free tier of Shifton includes the standard report templates for this stage. Between ten and forty employees, the seams start to show: too many data points, too few hours to compile them, decisions made too late because the report ran too late.
Above forty employees, the question is no longer whether to use real reporting software but which one. The cost of getting this wrong is a year of decisions made on impressions instead of data. The cost of getting it right is the operational backbone that lets the team scale without the management cost scaling at the same rate.
Frequently Asked Questions
What is workforce reporting software and what does it actually do?
Workforce reporting software turns scheduling data, time-clock logs, and attendance records into structured reports managers can act on. The category covers four main jobs: pre-built templates for the most common questions, a custom builder for industry-specific KPIs, scheduled delivery to stakeholders, and trend analysis that surfaces patterns over time. The output is decisions made on data instead of impressions.
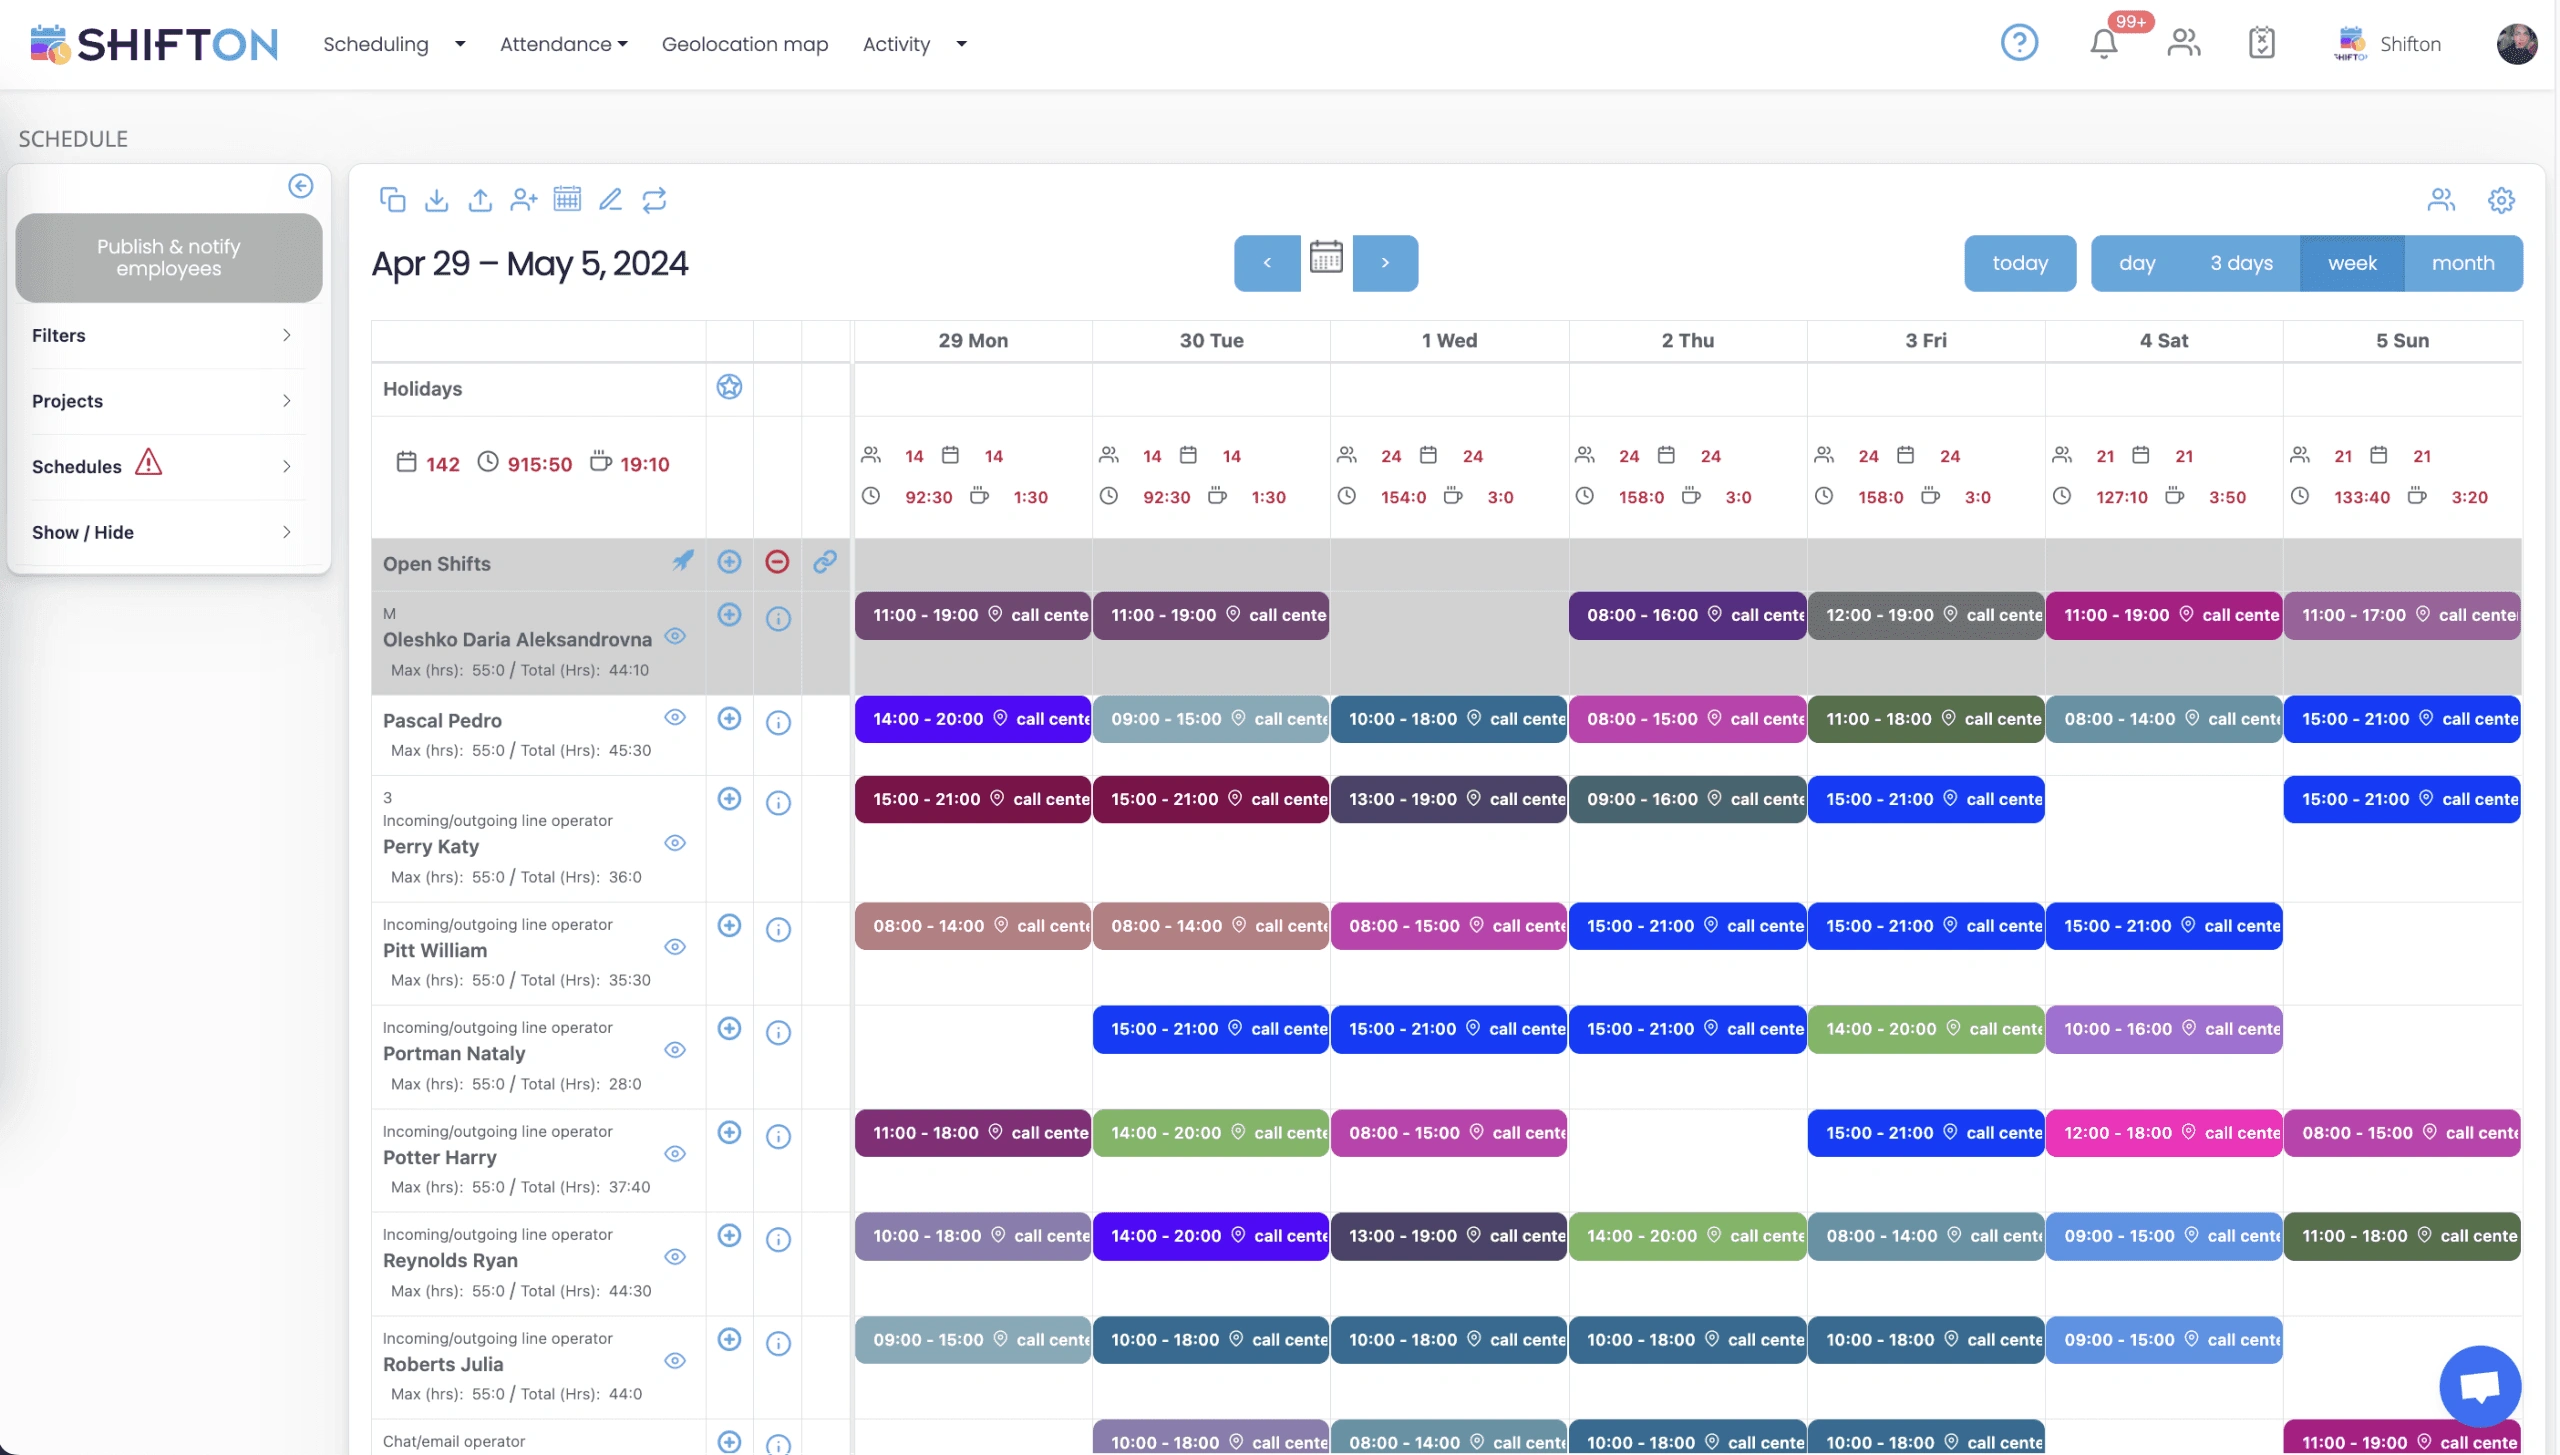
What types of reports does Shifton generate automatically?
Shifton generates attendance summaries, overtime cost breakdowns, schedule-vs-actual comparisons, and shift coverage gap reports out of the box. These run on live data from verified timesheets with no manual setup required. Each report can be filtered by location, department, role, or individual employee for a custom date range.
Can I build a custom report without technical skills?
Yes. The drag-and-drop report builder lets you pick metrics, date ranges, and grouping dimensions without writing any queries. Save the configuration as a template and reuse it on demand or on a fixed schedule. Custom KPIs like labor cost per transaction or picks per labor hour can be defined once and reused across the team.
How often is report data refreshed?
Dashboards pull clock-in and schedule data in real time, so figures update as employees work their shifts. Scheduled report exports capture a snapshot at the time they run. The historical trend reports refresh nightly and aggregate the prior day's data into the long-term series.
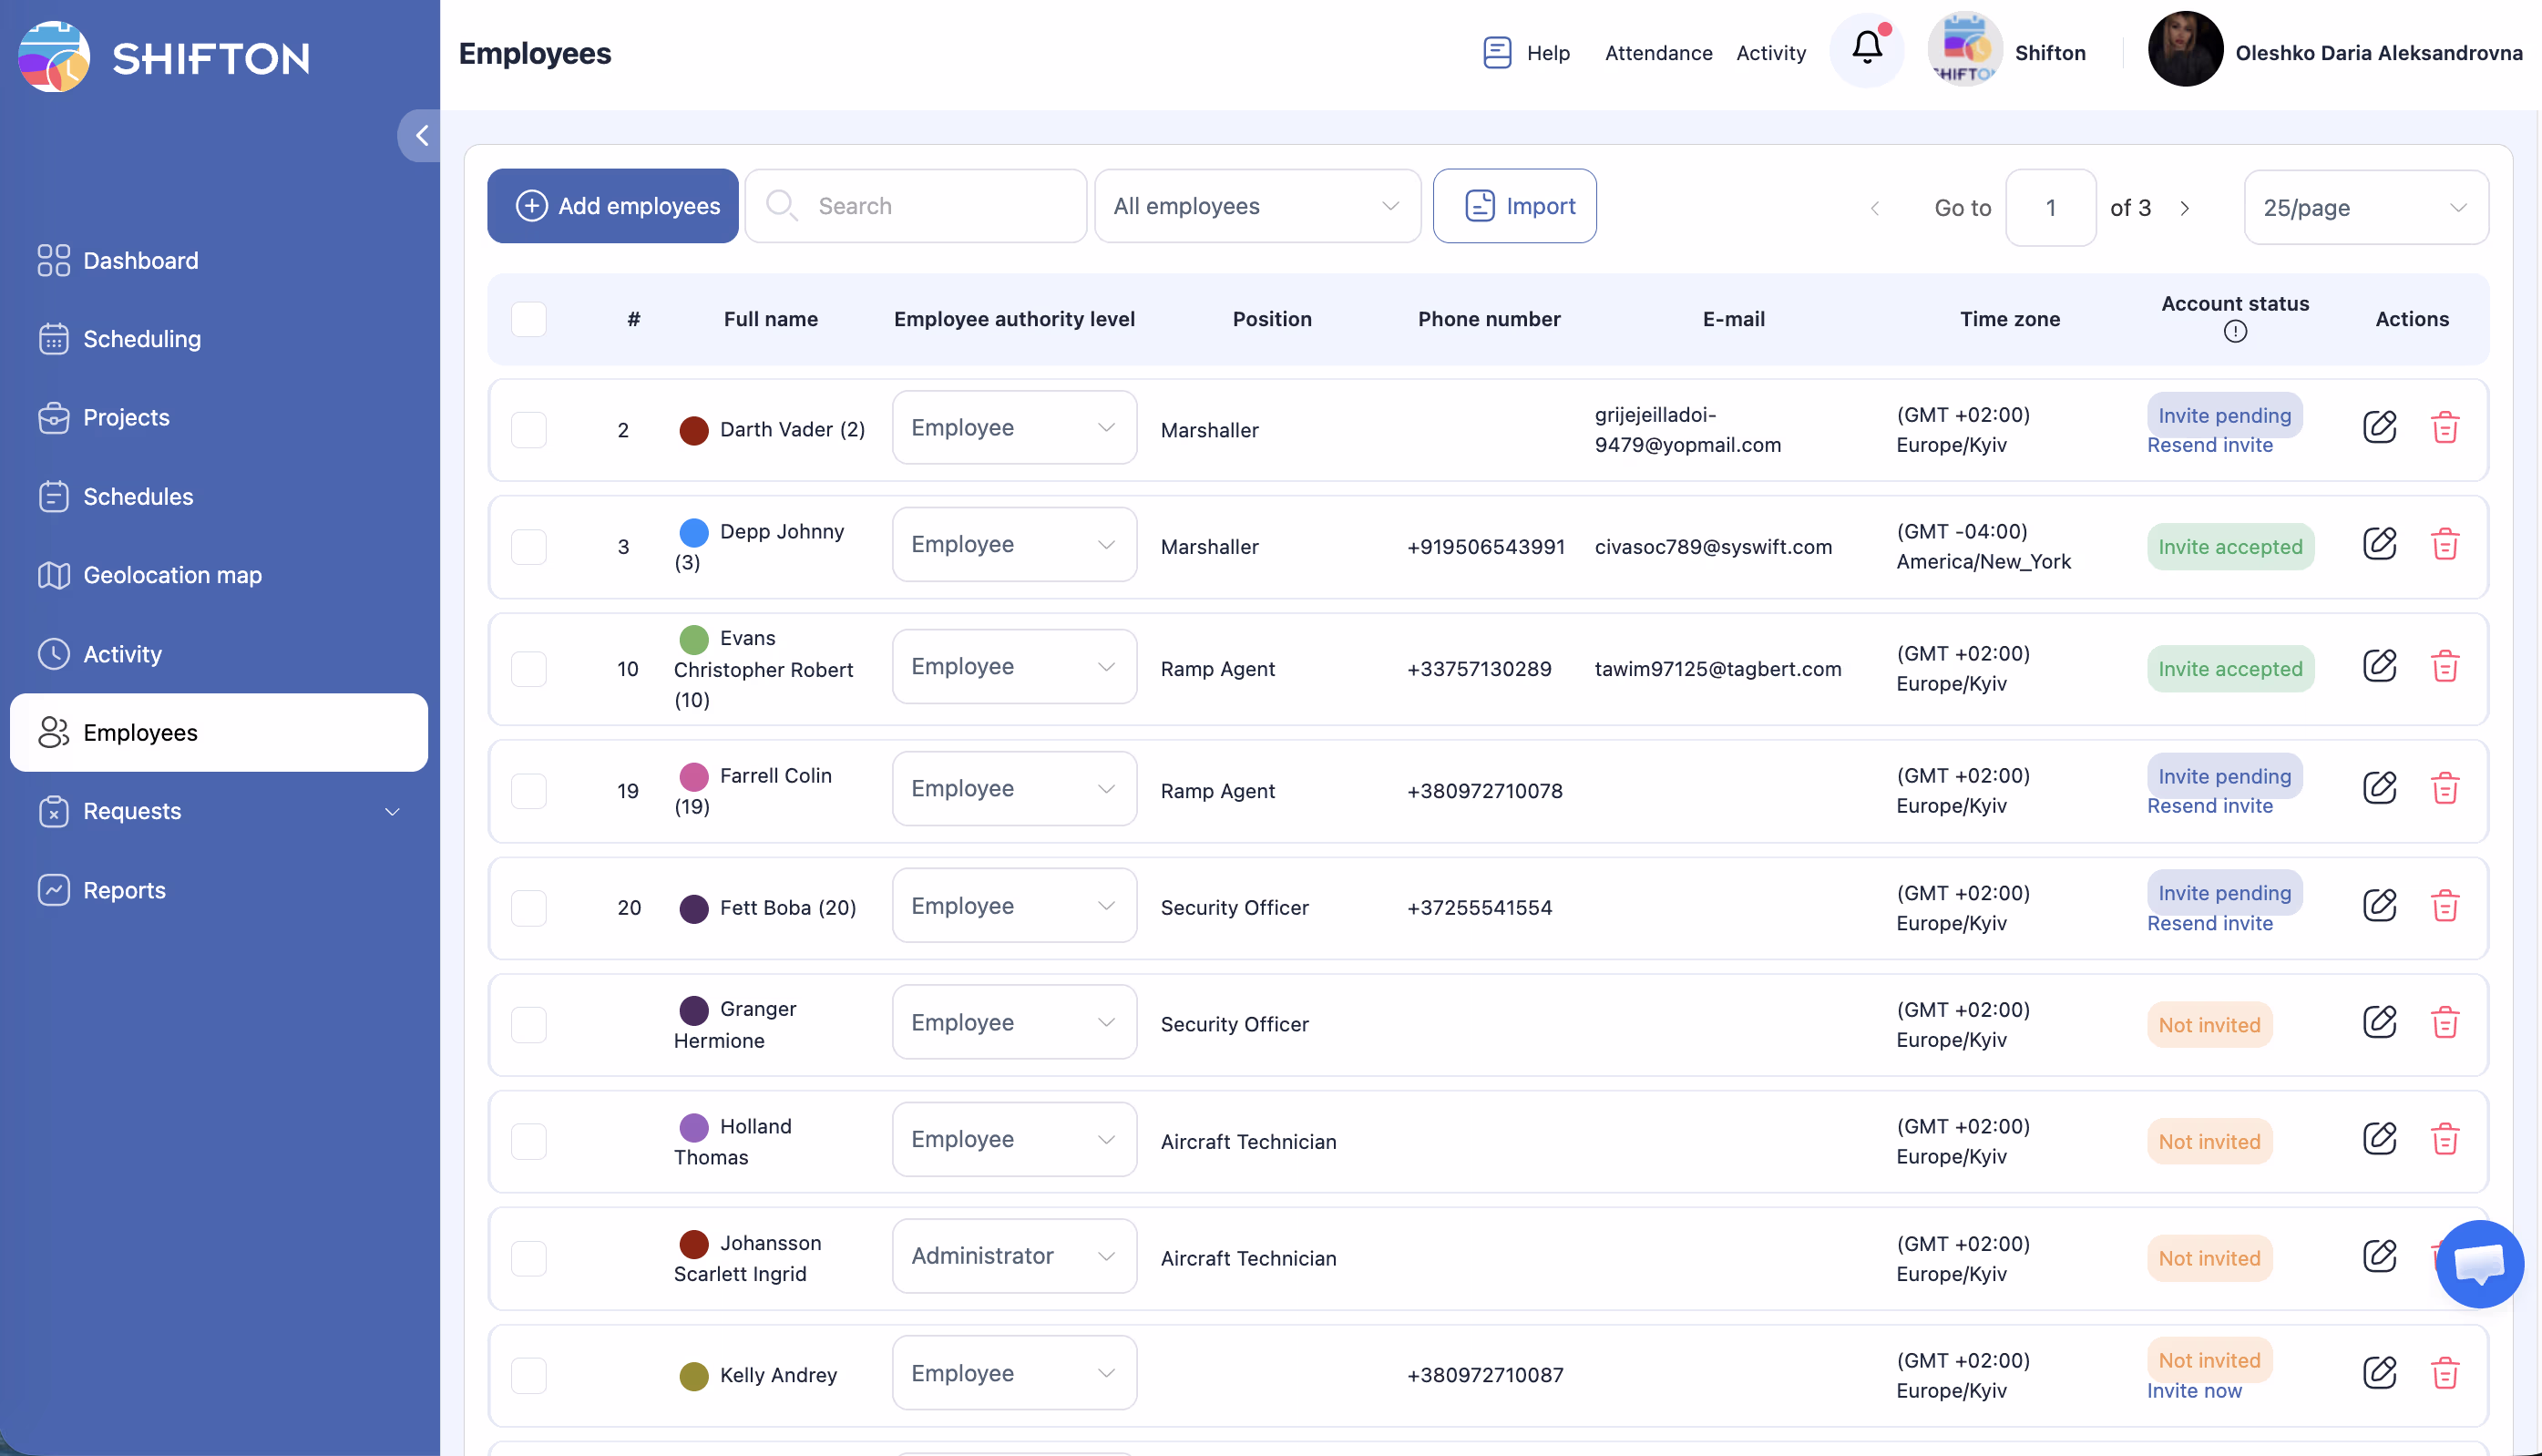
Who can see sensitive cost and performance reports?
Role-based permissions control access. Cost and compensation reports can be locked to finance leads. Operational reports are shared with team managers. Employee-specific reports stay restricted to that employee and their direct manager. Every report query is itself logged for audit.
Can Shifton send reports automatically by email?
Yes. Any saved report can be configured to deliver on a daily, weekly, or monthly schedule to a list of recipients. Reports arrive as PDF for executives or payroll-ready CSV for finance teams, without anyone needing to log into the platform.
What KPIs can I track with workforce reports?
Standard KPIs include punctuality rate, absence frequency, overtime hours per employee, schedule adherence percentage, shift pickup rate, and labor cost as a percentage of revenue. Custom KPIs are common: nurse-to-patient ratio, labor cost per cover for restaurants, picks per labor hour for warehouses, billable hours percentage for service businesses.
Does Shifton support trend analysis over multiple years?
Yes. Historical data is retained according to your configured retention policy, with most operations keeping multi-year history available for trend analysis. Seasonal demand forecasting uses up to three years of prior data to predict upcoming staffing needs. Turnover correlation analysis runs against the full history to find patterns.
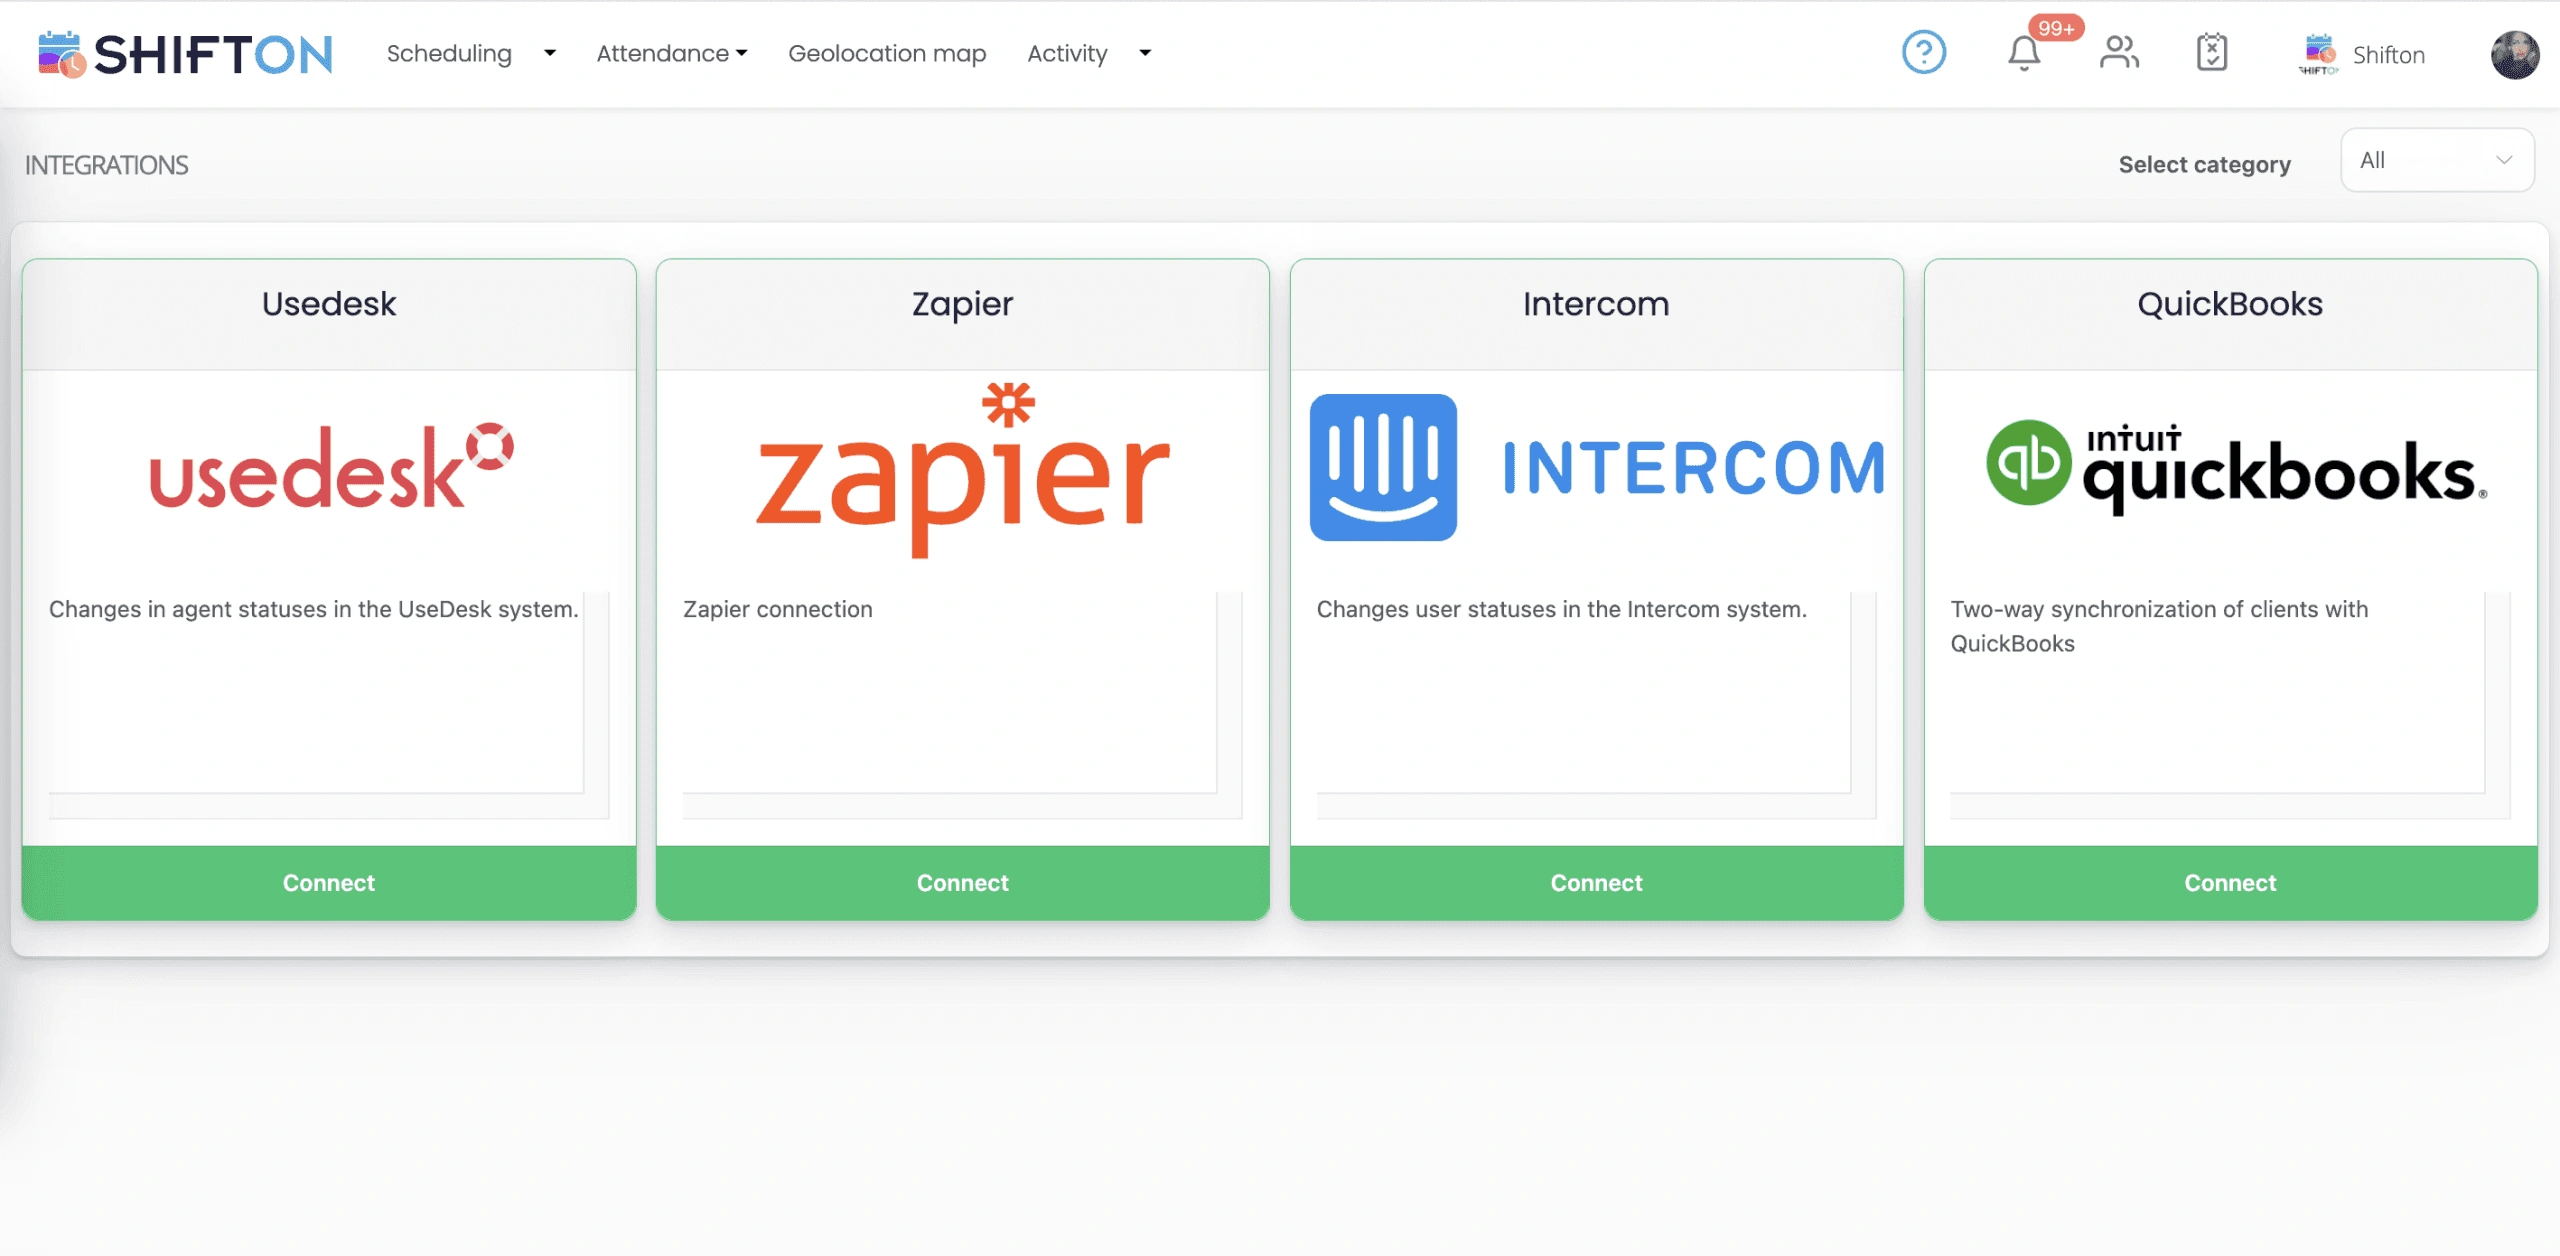
How does Shifton reporting integrate with payroll and HR systems?
Payroll-ready exports come in CSV format compatible with QuickBooks, Xero, ADP, and Gusto. Direct API integration is available for HR systems that support it, with automatic synchronization of approved hours. For systems without a direct connector, scheduled CSV exports cover the same job with a small amount of upfront mapping.
Can I share a report with someone outside my organization?
Reports can be exported as PDF and shared by email, or made available through a read-only public link with optional password protection and expiration date. Sharing settings are role-based, so only authorized users can generate external links. Every external share is logged for audit.
How long does it take to set up reporting in Shifton?
Pre-built reports are live the moment your data starts flowing in, usually within a day of setup. Custom report templates take a few hours of configuration depending on complexity. Larger operations typically have all standard reports running by the end of week one, with custom dashboards refined over the following weeks.
Is workforce reporting included in all Shifton plans?
Pre-built reports and standard exports are included from the free tier. Custom report builder, scheduled email delivery, and trend analysis come with the paid tiers. The first ten employees are free regardless of which features you use.


Ready to transform your field operations?
Join thousands of field service companies that trust Shifton to run smarter every day.