Отчети
Turn your field service data into actionable insights. Real-time dashboards show crew productivity, job completion rates, response times, and revenue per technician. Make decisions backed by data, not guesses.

Track the KPIs That Matter for Field Service
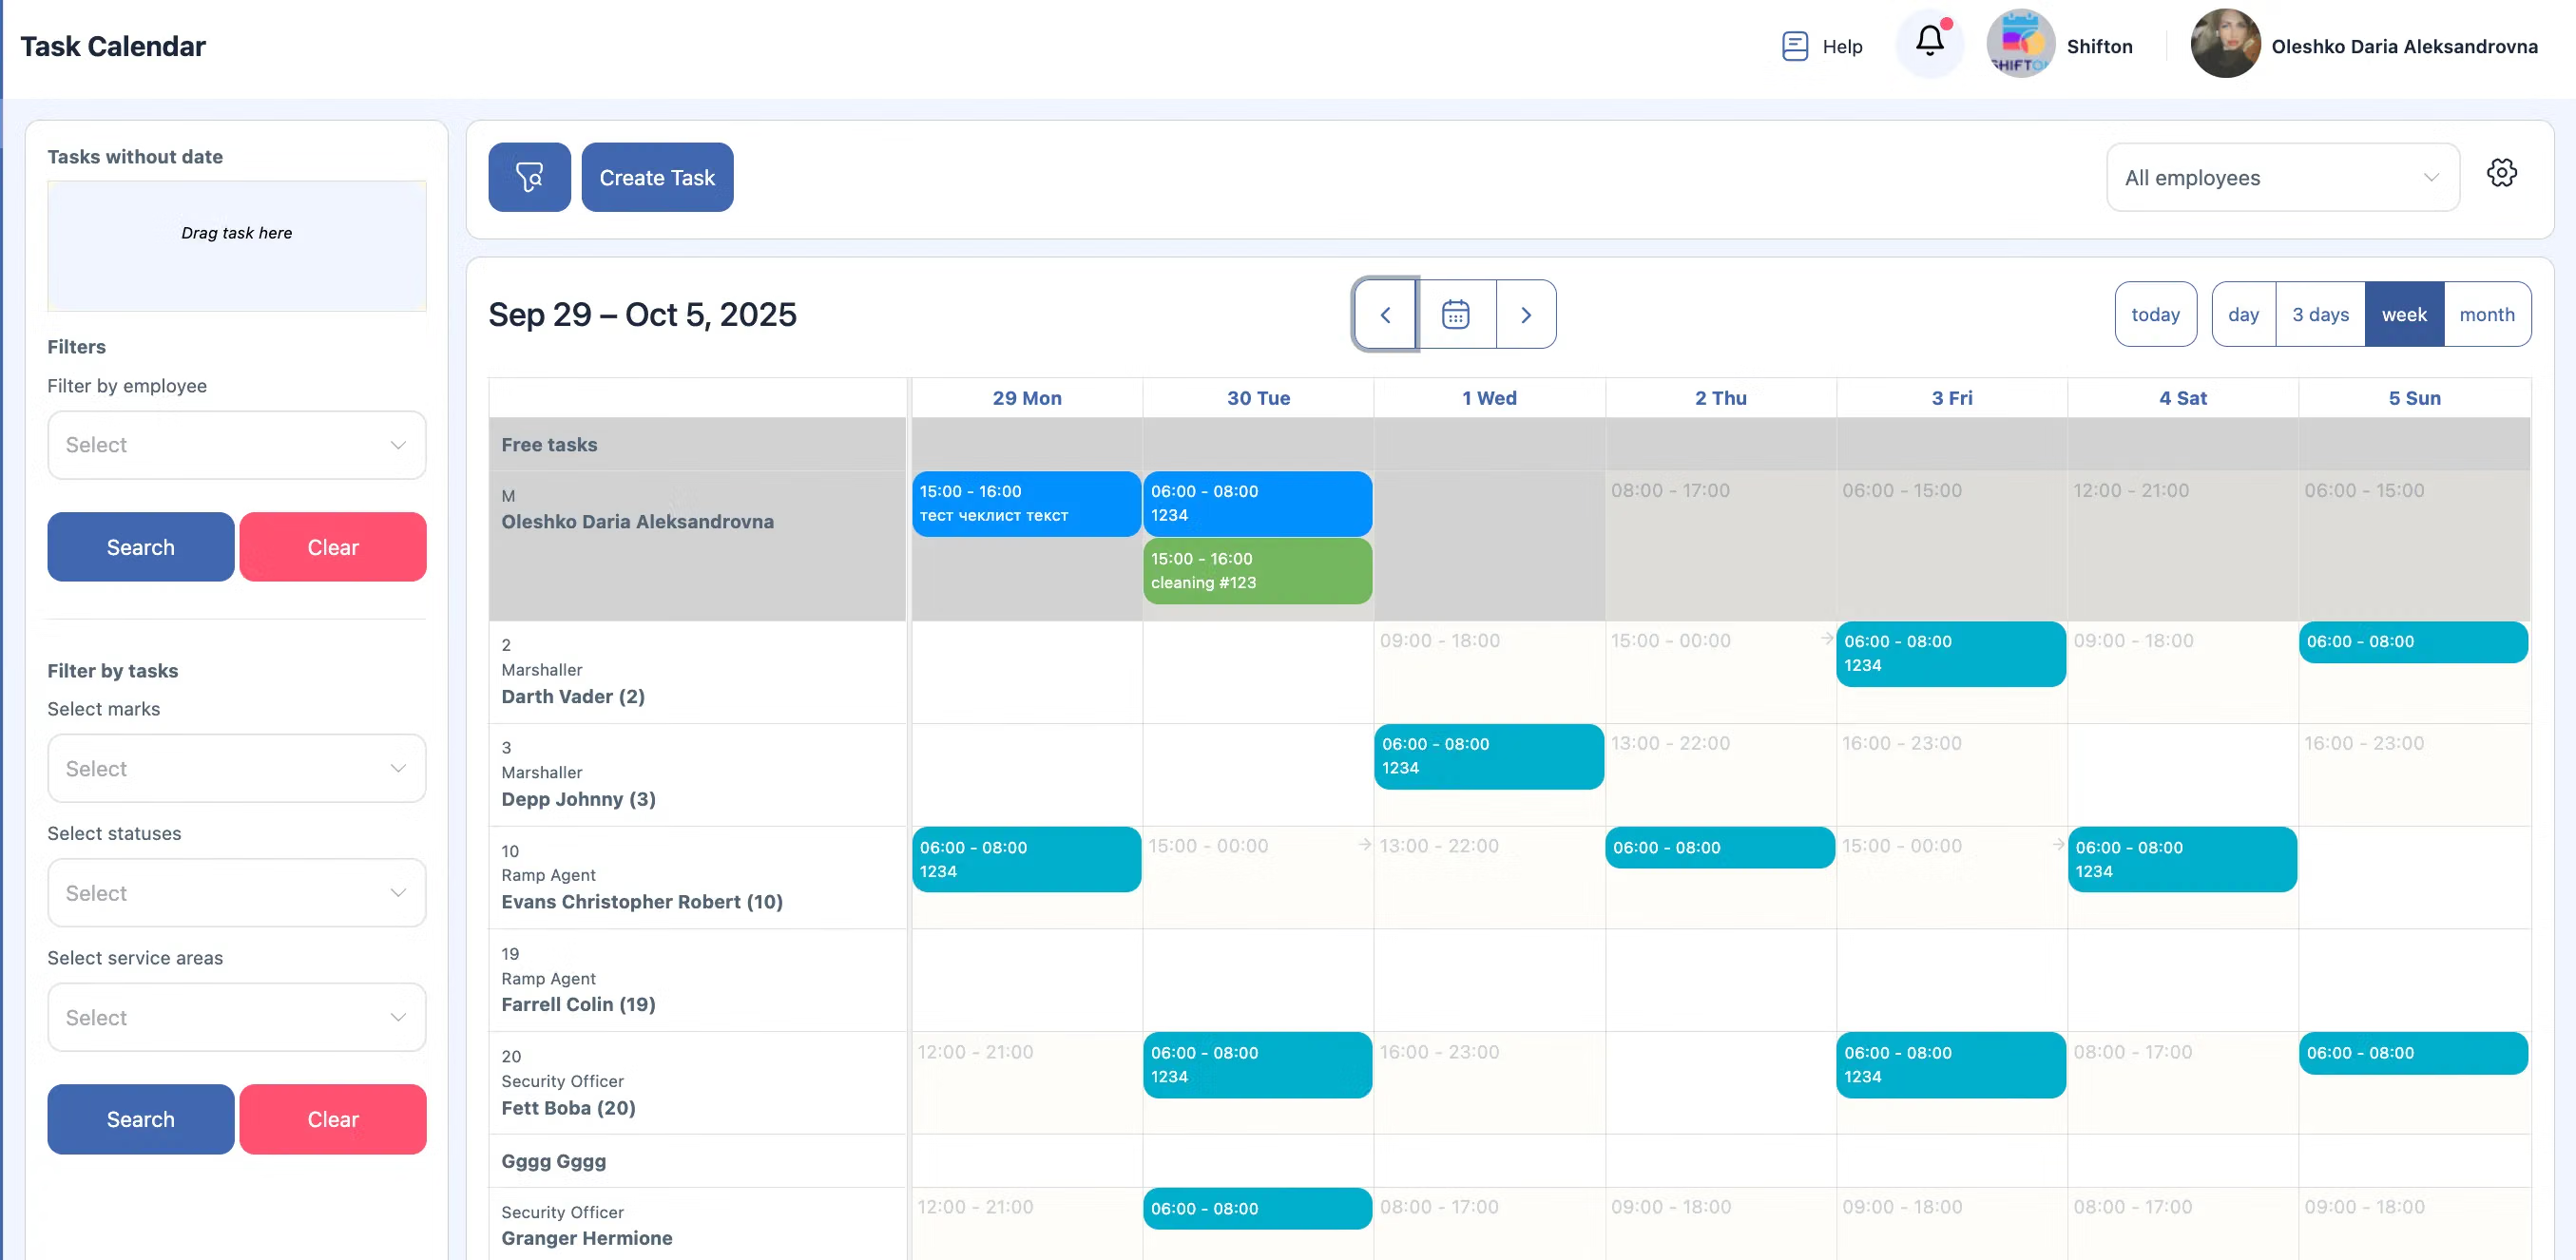
See who completed which tasks, how long each job took, and which assignments are still in progress — all on one dashboard.
Track every task through each stage — from creation to completion — to identify time gaps, bottlenecks, and workflow inefficiencies.
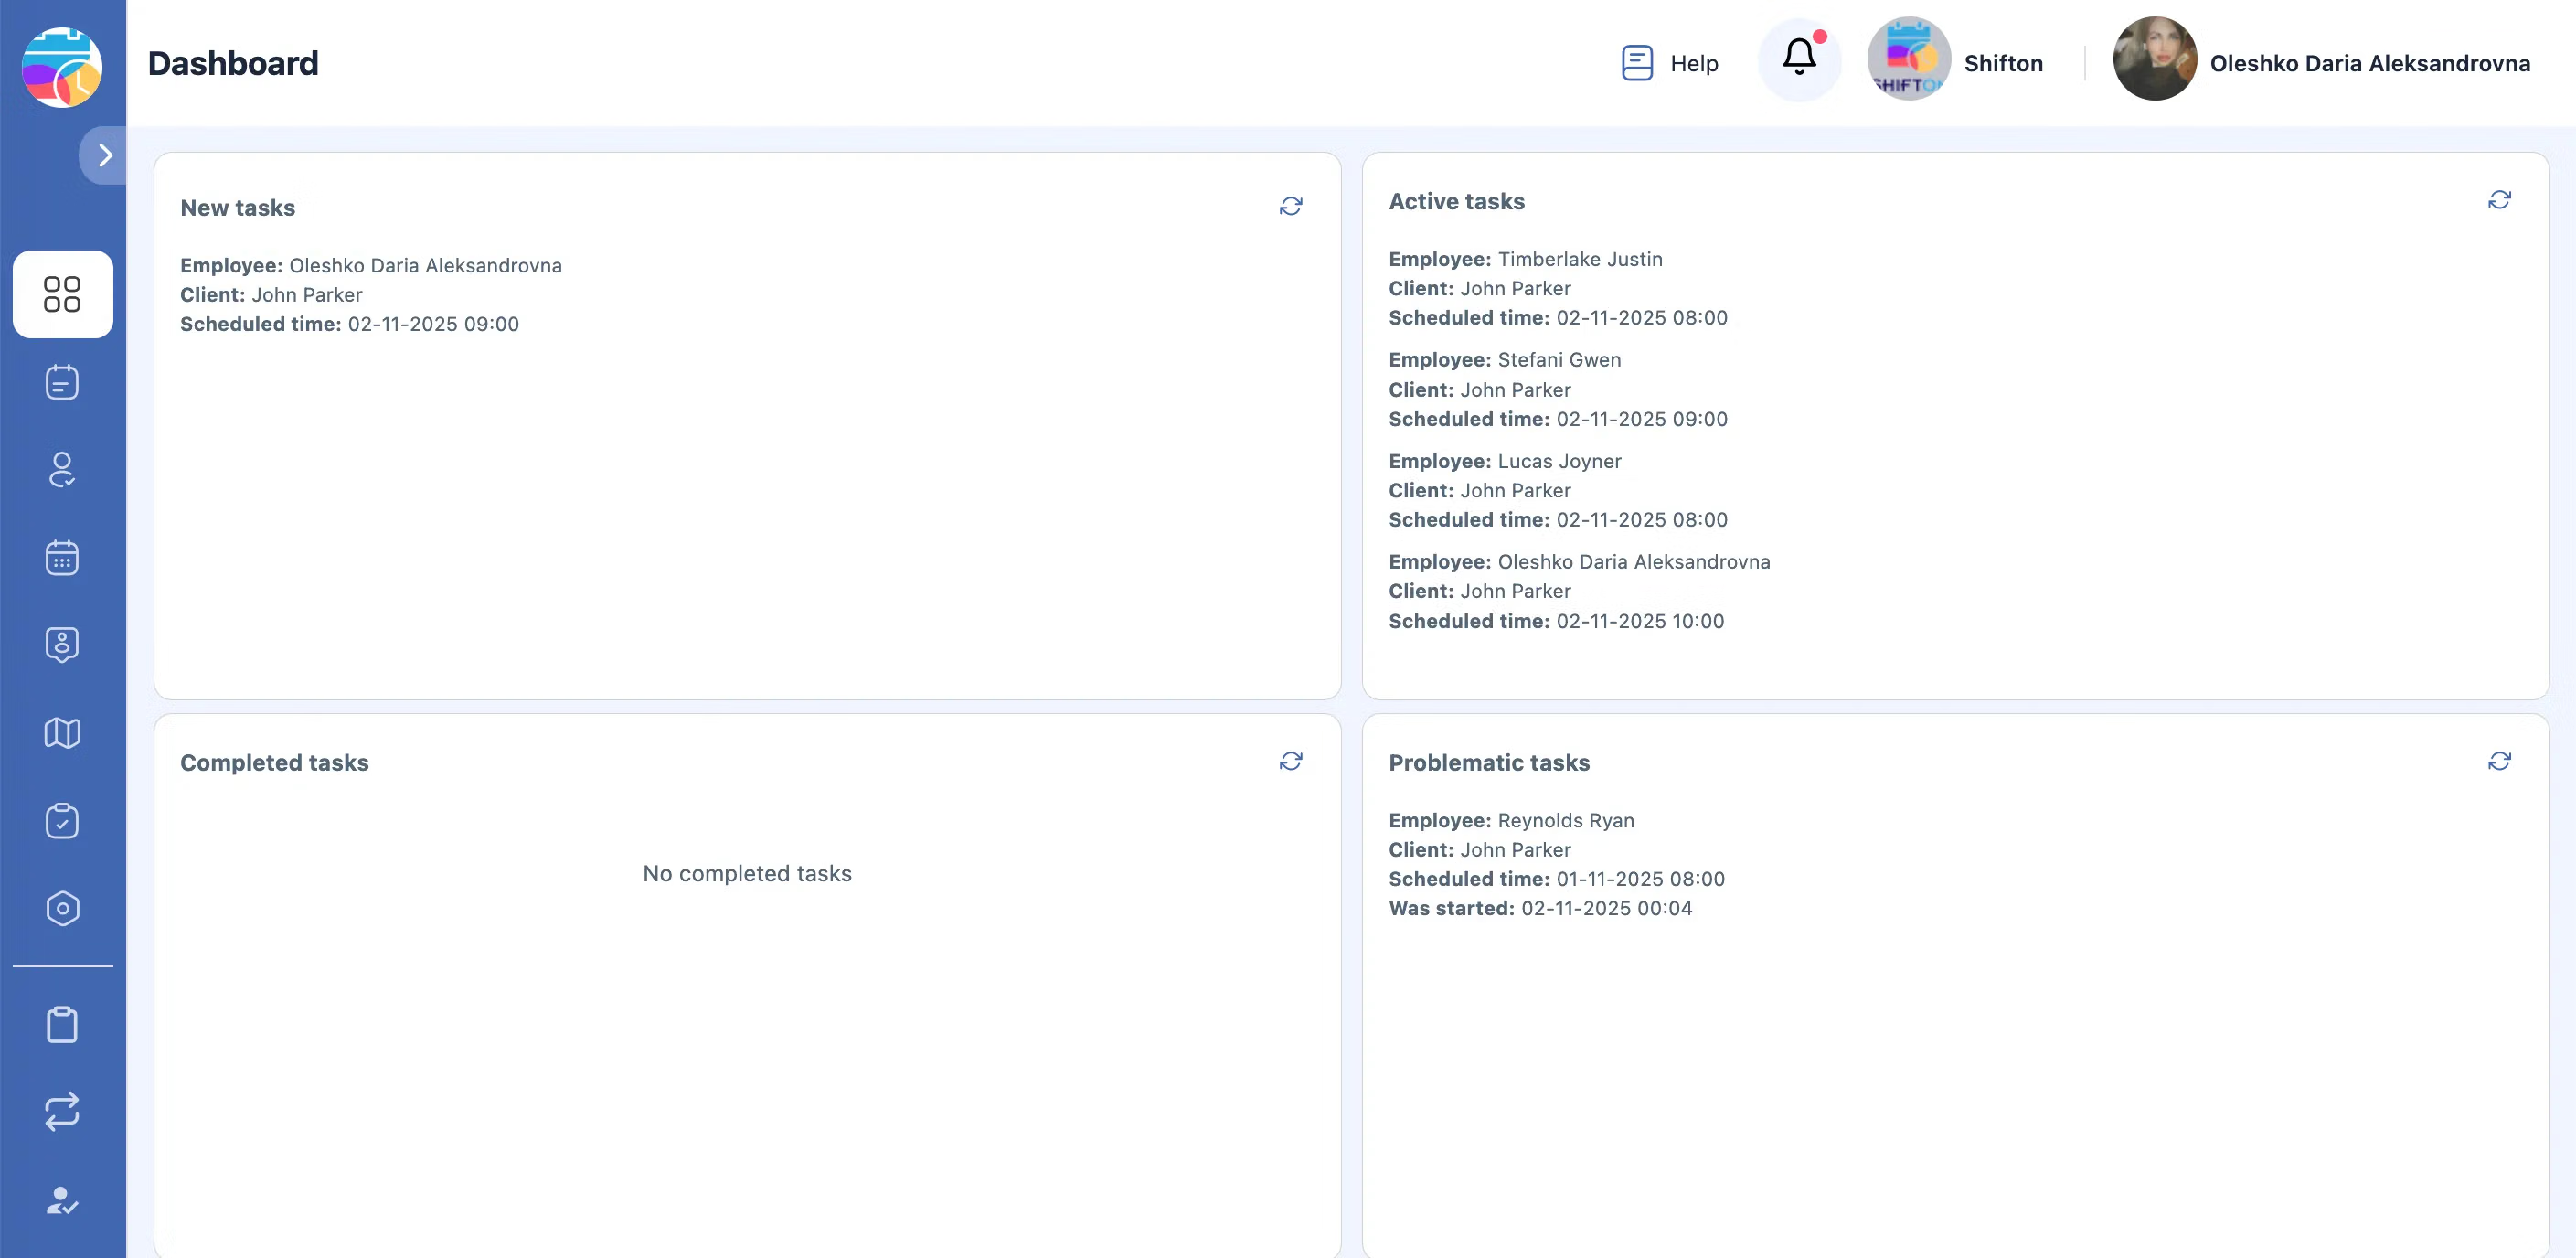
Turn raw operational data into clear KPIs that drive better planning, staffing, and resource allocation decisions.
Automated Field Reports — Accurate and Always Up to Date
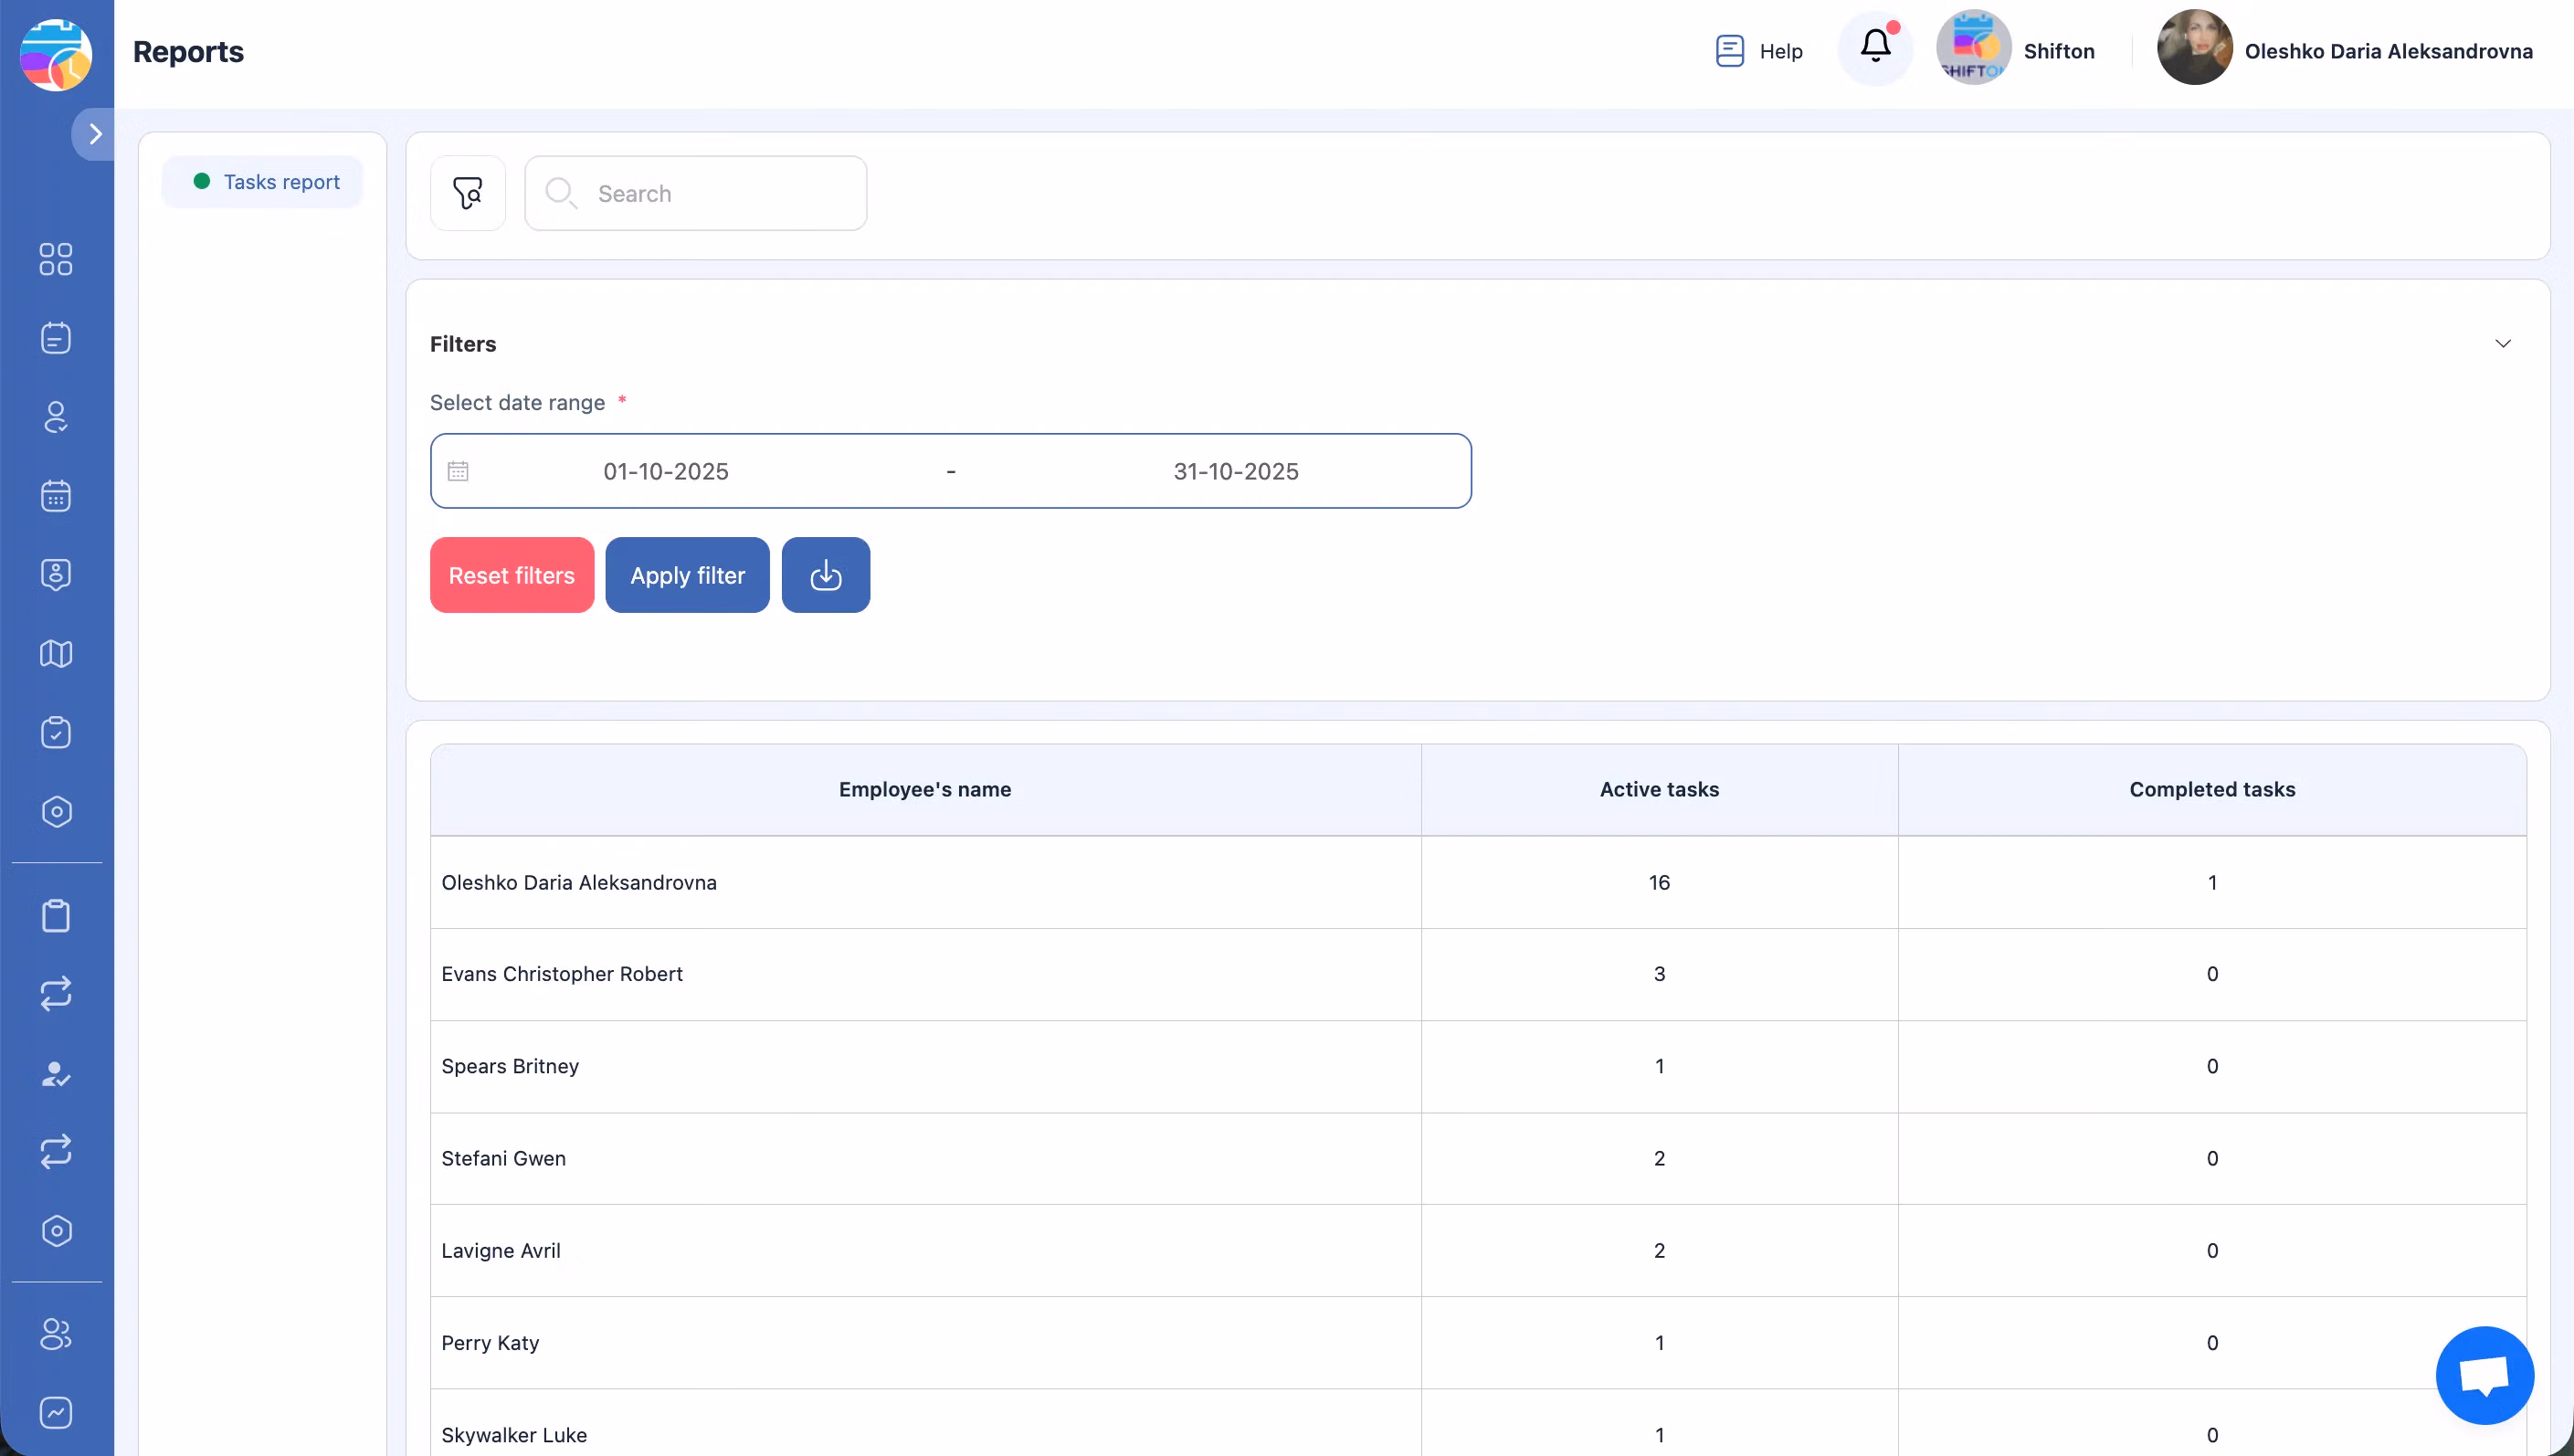
Reports are generated automatically and can be filtered by project, client, technician, or time period — no manual spreadsheet work.
Get objective, data-driven performance evaluations — eliminating guesswork when assessing team productivity and service quality.
From Data to Decisions — Optimize with Workforce Reporting Software
Detect weak points in your operations — whether it's slow routes, recurring delays, or uneven workload distribution across the team.
Recognize top performers and identify who needs support — using real completion data instead of subjective impressions.
Crew Productivity Analytics for Scalable Growth
Track growth trends over time — compare monthly completion rates, average job duration, and customer satisfaction across periods.
Make confident scaling decisions backed by historical data — know exactly when to hire, which zones need more coverage, and where to invest.
Започнете с Безплатния план
Без ограничение във времето. Получете пълен достъп до основните функции и надградете, когато сте готови.
Често задавани въпроси
What reports does Shifton provide?
Shifton offers dashboards for job completion rates, average response time, technician productivity, revenue per job, first-time fix rate, and customer satisfaction — all in real time.
Can I filter reports by date, team, or zone?
Yes. Every report is filterable by date range, technician, crew, service zone, job type, and client. Export to CSV or PDF.
Are reports generated automatically?
Yes. Dashboards update in real time as jobs are completed. You can also schedule automated email reports — daily, weekly, or monthly.
Can I track individual technician performance?
Yes. See each tech's job count, completion rate, average time on site, customer ratings, and revenue generated. Compare across the team.
Do reports help identify bottlenecks?
Yes. Spot patterns like recurring delays, high-cancellation zones, or underperforming time slots. Use data to adjust schedules and dispatch.
Can I track revenue and profitability per job?
Yes. Shifton reports revenue per job, per technician, and per zone — including labor costs, parts, and travel. See which jobs and clients are most profitable.
Is reporting included in the base plan?
Yes. Reporting dashboards and analytics are part of the Tasks base module, which is free for up to 2 employees. For larger teams, it costs $5.00 per employee per month.
Готови ли сте да трансформирате полевите си операции?
Присъединете се към хиляди компании за полеви услуги, които се доверяват на Shifton за по-умна работа всеки ден.