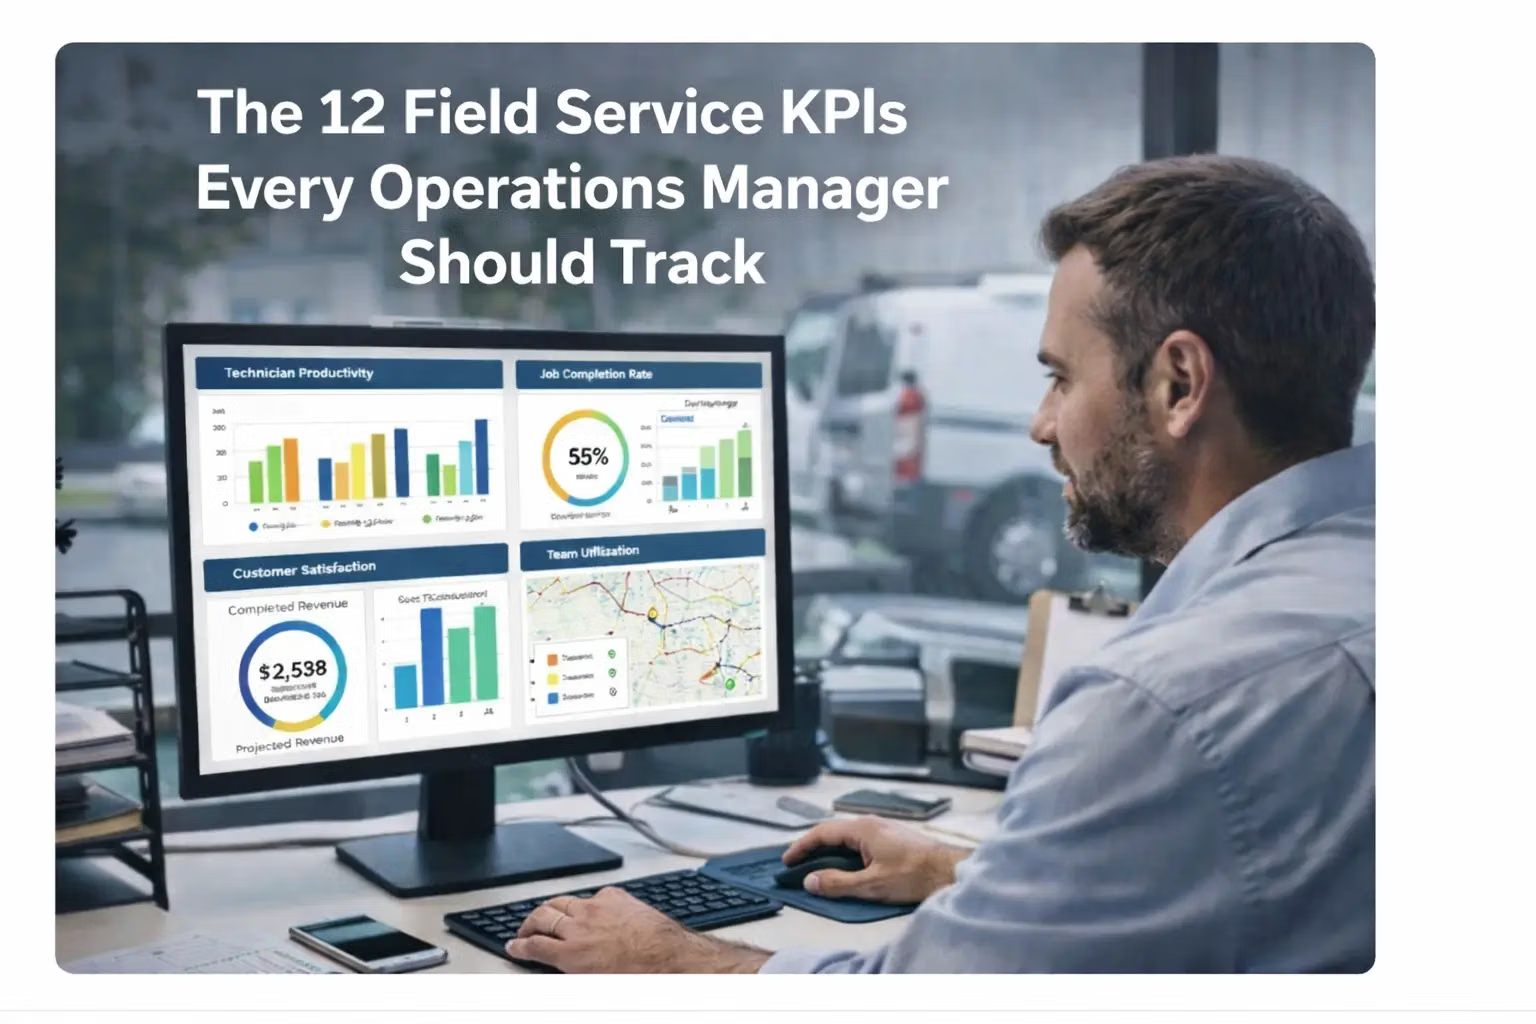
The 12 Field Service KPIs Every Operations Manager Should Track
Most field service teams collect far more data than they act on. The problem is not a lack of metrics — it is tracking the wrong ones, or tracking too many to focus on any of them. This guide covers twelve field service KPIs that directly connect to operational performance, customer satisfaction, and profitability — with formulas, benchmarks, and practical advice on what to do when each number moves the wrong way.
Whether you manage five technicians or five hundred, these are the metrics that operations leaders consistently identify as most predictive of business health. The global FSM market is growing from $5.1 billion in 2025 to a projected $9.17 billion by 2030, according to MarketsandMarkets — a pace driven in large part by enterprises that link operational KPIs directly to their software. Shifton's Field Servive workforce reporting module surfaces these metrics automatically from GPS clock-ins and job completions, without manual entry.
What Are Field Service KPIs — and Why the Distinction Matters
A metric is any measurable data point — average drive time, jobs completed this week, parts used per job. A KPI is a metric you have deliberately chosen as critical to your business goals and track consistently over time to guide decisions. Every KPI is a metric, but not every metric deserves to be a KPI.
The practical test: if your team would not change their behaviour based on a number moving, it should not be a KPI. Start with five to seven, tied to your current biggest operational challenge, and track those with discipline before expanding. Field service KPIs fall into four natural categories — understanding which category a metric belongs to tells you who owns it and when to act on it.
Operational Efficiency
First-time fix rate, mean time to repair, technician utilization, SLA compliance.
Customer Experience
CSAT score, NPS, response time, complaint resolution rate.
Financial Performance
Job profitability, cost per service call, revenue per technician, overtime ratio.
Workforce & Scheduling
Schedule adherence, jobs per technician per day, travel time ratio.
The 12 Field Service KPIs That Actually Move the Needle
First-Time Fix Rate (FTFR)
The percentage of service calls resolved completely on the first visit, without a return trip. This is widely considered the single most important operational KPI in field service — it captures efficiency, preparedness, and customer satisfaction in one number. According to TSIA's field service KPI research, FTFR is one of the metrics most consistently correlated with customer retention and contract renewal across industries.
How to improve it: Low FTFR almost always traces to one of three causes — technicians arriving without the right parts, insufficient job information in the work order, or mismatched skill assignments. Connecting your inventory management directly to the dispatch workflow so parts are verified before job assignment is the single highest-impact fix.
Mean Time to Repair (MTTR)
The average time from when a technician begins work on a job to when it is marked complete. MTTR measures what happens on-site — not how long it took to get there. It is the primary diagnostic for technician technical efficiency and is most useful when segmented by job type and individual technician rather than viewed as a single aggregate number.
How to improve it: High MTTR by job type reveals training gaps. High MTTR by individual technician points to a skill mismatch in dispatch assignments. Structured digital job forms with pre-populated checklists reduce on-site decision time by ensuring technicians follow a consistent diagnostic sequence every time rather than figuring it out on arrival.
Average Response Time
The average time between when a service request is received and when a technician is on-site. Response time is one of the most customer-visible KPIs in field service. In industries like plumbing and electrical, a delay does not just frustrate customers — it often makes the underlying problem worse. According to Mordor Intelligence, scheduling, dispatch, and route optimization is the leading solution segment in the FSM market — demand driven precisely by the pressure to bring response times down.
How to improve it: Smart dispatch that assigns the nearest qualified technician — not just the next available one — produces the biggest single-step reduction. Geo-routing has helped operations cut average response from three hours to under 90 minutes by switching to proximity-based assignment. See our guide on field service dispatch software for how automated assignment works in practice.
Technician Utilization Rate
The percentage of a technician's working hours spent on billable service activities, as opposed to travel, idle time, and admin. This is the primary indicator of whether scheduling is converting labor capacity into revenue. Most field service teams run at 60–70% utilization when 85%+ is achievable — the gap is almost always excess travel time and manual administrative work that has not yet been automated.
How to improve it: GPS-verified clock-ins, automated route chaining, and mobile job completion replace end-of-day paper reconciliation — each adding measurable billable hours back into a technician's day. Teams that implemented scheduling dashboards have reported 18% utilization gains and 25% more billable hours per month without adding headcount.
SLA Compliance Rate
The percentage of jobs completed within the response and resolution windows committed to in service agreements. SLA compliance is both a customer satisfaction metric and a financial one — breached SLAs trigger penalties, erode renewals, and are the most reliable early warning of systemic dispatch problems. Teams that move from reactive to proactive SLA monitoring consistently push compliance from the 60s into the 90s.
How to improve it: SLA compliance requires proactive alerts — warnings that fire before a window closes, not notifications that a breach already happened. Shifton's instant alerts module flags at-risk jobs automatically, giving dispatch 30–60 minutes to act before an SLA is broken rather than reacting after the fact.
Customer Satisfaction Score (CSAT)
A post-service rating measuring customer satisfaction with the service experience. Aberdeen Group identifies customer satisfaction as the leading measure of success in field service management, cited by 68% of high-performing organisations ahead of pure operational efficiency. Organisations that actively track KPIs show 20% higher CSAT than those that do not, alongside 15% higher technician productivity. Read our overview of field service operations for how the full workflow from dispatch to sign-off connects to customer experience.
How to improve it: CSAT is most sensitive to arrival time accuracy and technician communication. Automated ETA notifications — "your technician is 20 minutes away" — consistently lift scores even when wait time itself has not changed. Customer signature capture and job completion proof reduce post-service disputes that drag scores down.
Travel Time per Job
The average time a technician spends traveling between jobs. Excess travel is the most visible sign of inefficient scheduling and the most direct lever for reducing overtime without cutting headcount. McKinsey research confirms that reducing daily travel time by even one hour can free capacity for one to two additional jobs per technician per day — a direct revenue impact without adding staff.
How to improve it: Route chaining — grouping nearby jobs in sequence rather than by arrival time alone — is the primary lever. Teams using location-aware scheduling have reduced travel time per job by 15–25%, enabling one or two additional completions per technician per day. Our field service route optimization guide covers the mechanics of intelligent job sequencing in detail.
Schedule Adherence Rate
The percentage of jobs where technicians arrive within the promised service window. Schedule adherence is a direct driver of CSAT — customers who experience on-time arrivals rate their service significantly higher regardless of technical complexity. Customers who experience missed windows rarely complain directly; they quietly switch providers. The signal shows up in renewal rates, not complaint logs.
How to improve it: Low schedule adherence is usually a buffer problem — windows are too tight or job duration estimates are inaccurate. Analysing actual vs. estimated completion times by job type and updating scheduling templates accordingly is the most reliable fix. Real-time GPS visibility lets dispatch adjust proactively when a job runs long, rather than reacting after the next appointment is already missed.
Jobs Completed per Technician per Day
The average number of jobs each technician closes in a working day. This is the core productivity metric that tells you whether scheduling is converting available hours into completed service efficiently. Four or more jobs per day is a broadly cited healthy benchmark, though the right target varies significantly by industry and average job duration. Track your own baseline trend over time rather than chasing a single industry number.
How to improve it: Compare this metric against travel time per job. Low jobs per day with low travel time means the issue is job duration — look at training and tooling. If travel time is high, the issue is routing. If both are acceptable, look at admin time — paperwork and manual reporting that mobile job completion can eliminate entirely.
Overtime Hours Ratio
The percentage of total labor hours worked as overtime. A creeping overtime ratio signals that scheduling is unbalanced — some technicians are overloaded while others sit idle — or that job duration estimates are too optimistic, causing workdays to run long. Forecasted scheduling reduces overtime by 10–20% in most operations by matching capacity to demand in advance rather than reacting to it. The benefits of field service scheduling software are most tangible here: planned vs. actual hour comparisons make overtime trends visible before they become a payroll crisis.
How to improve it: Workload balancing across technicians — visible in a planning dashboard — prevents the pattern of one technician finishing late while another sits idle two zones away. Reviewing planned vs. actual hours weekly catches imbalances before they compound into sustained overtime.
Job Profitability
Gross profit per job after accounting for labor, parts, and direct overhead. Tracking job profitability by job type, technician, and customer reveals which work actually makes money — and which looks busy but erodes margin. A healthy target for most field service operations is 30–50% gross profit margin per job. According to Fortune Business Insights, the FSM market's rapid growth is partly driven by enterprises focusing on profitability analytics — moving from volume metrics to margin-level visibility.
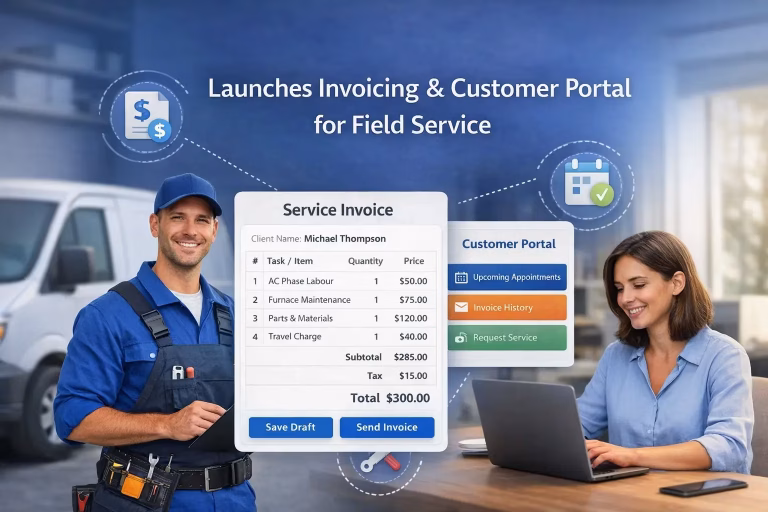
How to improve it: If repeat visits are adding unbilled labor cost, that directly crushes margin. Accurate invoicing tied to actual work order data — including all materials used — is the foundation. Shifton's invoicing module auto-generates invoices from completed work orders with labor, materials, and customer signatures pre-populated, eliminating billing lag between field and office.
Repeat Service Call Rate
The percentage of completed jobs that generate a return visit within 30 days for the same issue — the inverse of FTFR at the job level. Every repeat trip means double the labor and travel cost on a job already quoted once. A high repeat rate signals that jobs are being closed without genuinely resolving the underlying problem, whether due to misdiagnosis, incomplete repair, or missing parts on the first visit.
How to improve it: Track repeat calls by technician and by job type separately. Patterns by technician point to training gaps. Patterns by job type point to systemic issues — wrong parts specification, insufficient diagnosis time in the job template, or a recurring equipment fault that needs a different resolution approach.
How to Build a KPI Tracking System That Actually Works
Identifying the right KPIs is only half the work. Collecting clean data, reviewing it consistently, and acting on it is the other half — and where most operations fall short. Grand View Research projects the FSM market reaching $11.78 billion by 2030, with analytics and reporting cited as one of the primary drivers of platform adoption. The six practices below separate teams that use KPIs to drive improvement from teams that build dashboards no one reads.
The bottom line: You do not need to track all twelve KPIs from day one. Pick the four or five that match your current biggest operational challenge and track them with discipline. As those numbers improve, expand your KPI set. The best-performing field service teams run on a small number of metrics tracked consistently — not a large dashboard reviewed infrequently.
Frequently Asked Questions
What is the most important KPI in field service management?
First-time fix rate (FTFR) is most consistently cited as the single most important KPI. It captures operational efficiency, preparedness, and customer satisfaction in one number. The industry median sits around 72%, with best-in-class organisations reaching 80% or above.
What is a good first-time fix rate benchmark?
The industry median is approximately 72%. Anything above 75% is considered strong, and best-in-class operations in predictable service environments reach 80–89%. Below 65% almost always means parts availability, job information quality, or dispatch skill-matching needs attention.
What is the difference between a field service KPI and a metric?
A metric is any measurable data point. A KPI is a metric you have intentionally chosen as critical to a business goal and track consistently to guide decisions. The practical test: if your team would not change behaviour based on a number moving, it should not be a KPI.
How do I improve technician utilization rate?
Most teams run at 60–70% when 85%+ is achievable. The gap is almost always excess travel and manual admin. Location-aware dispatch, GPS-verified clock-ins, and mobile job completion forms each add billable hours back into a technician's day without extending working time.
How many field service KPIs should I track?
Start with five to seven. More than that creates noise and dilutes focus. Choose KPIs that are directly actionable, tied to your current biggest challenge, and measurable with data you can realistically collect. Expand the set incrementally as performance improves.
What is a good SLA compliance rate for field service?
A target of 90%+ is standard for most service operations. Teams with formal contracts typically target 95%+. Below 80% is a serious warning — it usually means windows are unrealistically tight, job durations are under-estimated, or there are no proactive alerts before windows close.
How do field service KPIs connect to customer satisfaction?
First-time fix rate, response time, and schedule adherence are the three operational KPIs most directly linked to CSAT. When technicians arrive on time, resolve the issue on the first visit, and respond quickly, satisfaction scores rise regardless of technical complexity. Aberdeen Group identifies customer satisfaction as the primary measure of field service success, ahead of pure operational efficiency.


Start making changes today!
Optimize processes, improve team management, and increase efficiency.